If you work with recurring reports, it’s common to receive the same structure split across multiple tabs or files. Merging those sheets into one place helps you analyze faster and reduce errors. Typical situations include:
- Monthly or regional reports: North, South, East, and West tabs that need to become one unified table.
- Budget rollups: Department sheets that must be summarized into a company total.
- Sales pipelines: Reps maintain separate tabs and you need a single view.
- Inventory snapshots: Multiple warehouse sheets combined into one stock ledger.
- Event registrations: One tab per event date consolidated into a master attendee list.
- Survey waves: Responses collected across weekly sheets that should be stacked.
- Data integration: Two sheets with shared IDs where you need to bring columns together.
- KPI dashboards: Merge source tabs, then build a pivot or chart from the combined data.
- Vendor or SKU catalogs: Different suppliers’ sheets that must align by common headers.
- Financial close: Trial balances across entities combined and summarized.
If it’s a small, one-off task, simple copy and paste can be fine. As soon as you need repeatability, accuracy, or anything more complex, the methods below will save you a lot of time.
Sample data we’ll use
To keep things concrete, imagine three sheets named North, South, and West. Each contains the same columns.
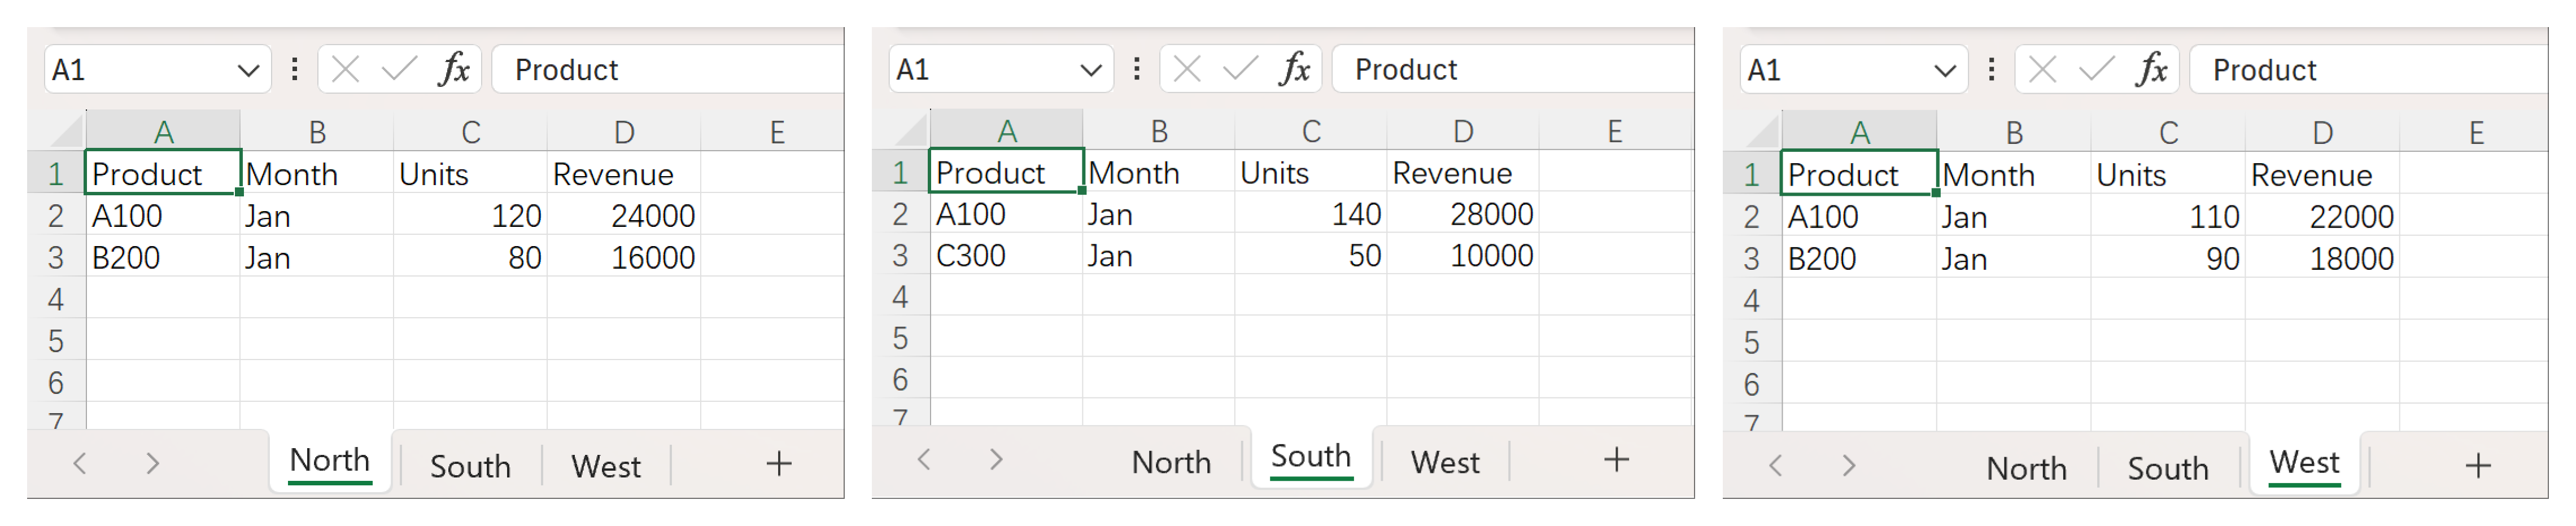
Assume each sheet is formatted as an Excel Table with names North, South, and West.
Option 1: Consolidate to summarize numbers
Use this when you need totals, averages, counts, and similar numeric summaries across sheets.
- On a blank “Consolidate” sheet, select the top-left destination cell.
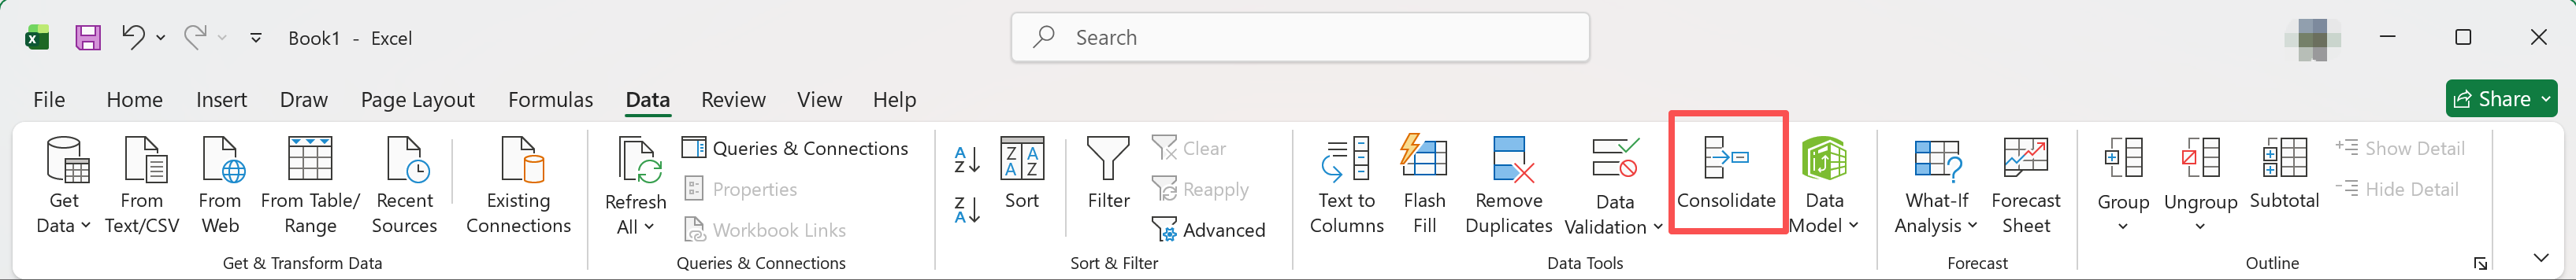
Go to Data > Consolidate.
- Pick the function, for example
Sum. Add each source range to All references. If your tables include headers, include those, then check Top row and/or Left column under Use labels.
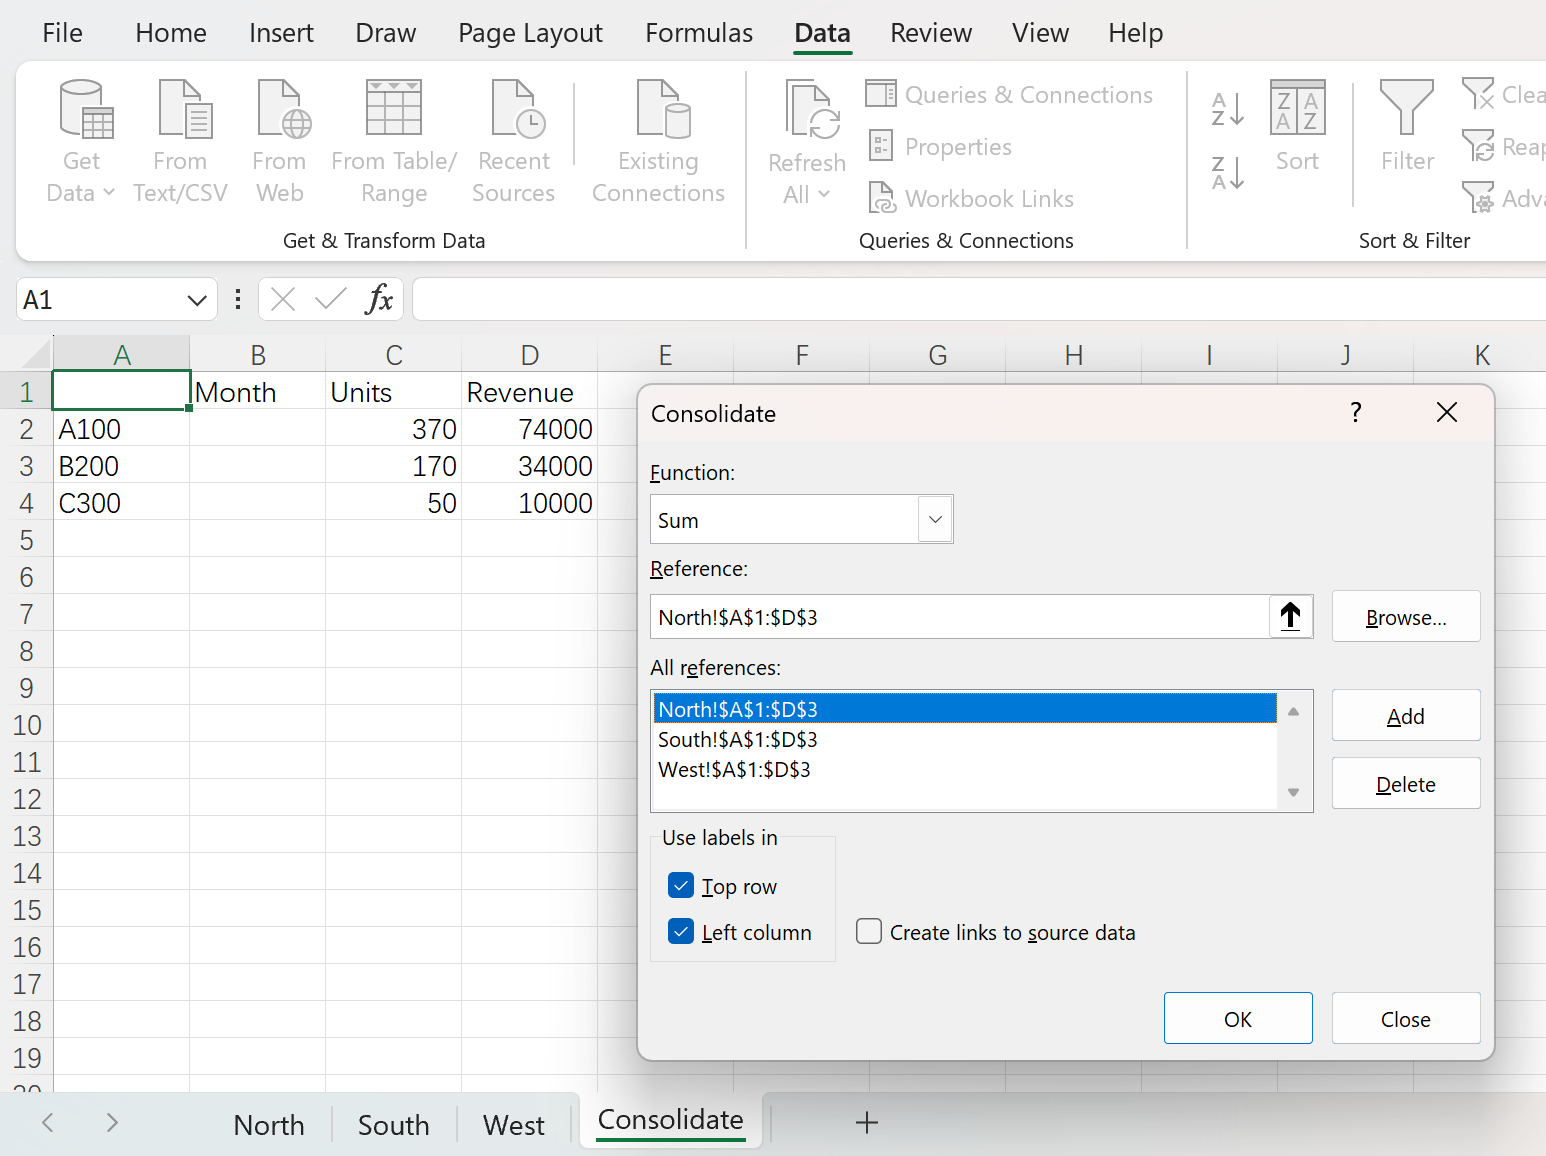
- Optional: check Create links to source data to keep the summary updating when the inputs change.
- Select OK.
Consolidate by position works when data blocks are in the same layout and location across sheets. Consolidate by category works when labels match but ranges are not in the same position. This feature is great for numeric rollups. It does not copy text fields into one list.
When to choose this
- You only need combined totals or averages.
- Your sheets share the same labels and there are no blank rows or columns inside the ranges.
Limitations to note
- Designed for numbers. If you want one long transactional table, use stacking or AskExcel instead.
- Labels must match exactly for category-based consolidation.
Option 2: Stack sheets into one long table
If you want a single, analysis-ready table, stacking is usually best. With Microsoft 365 or Excel 2021, dynamic array functions make this easy.
Quick stack when columns match
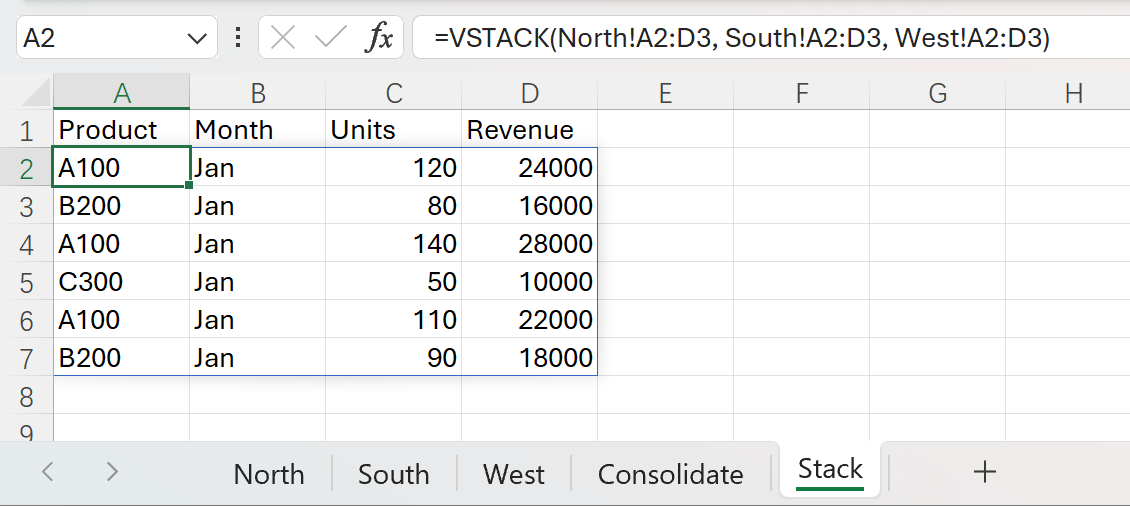
On a new sheet:
=VSTACK(North!A2:D3, South!A2:D3, West!A2:D3)
That spills a unified table of all rows from the three sheets.
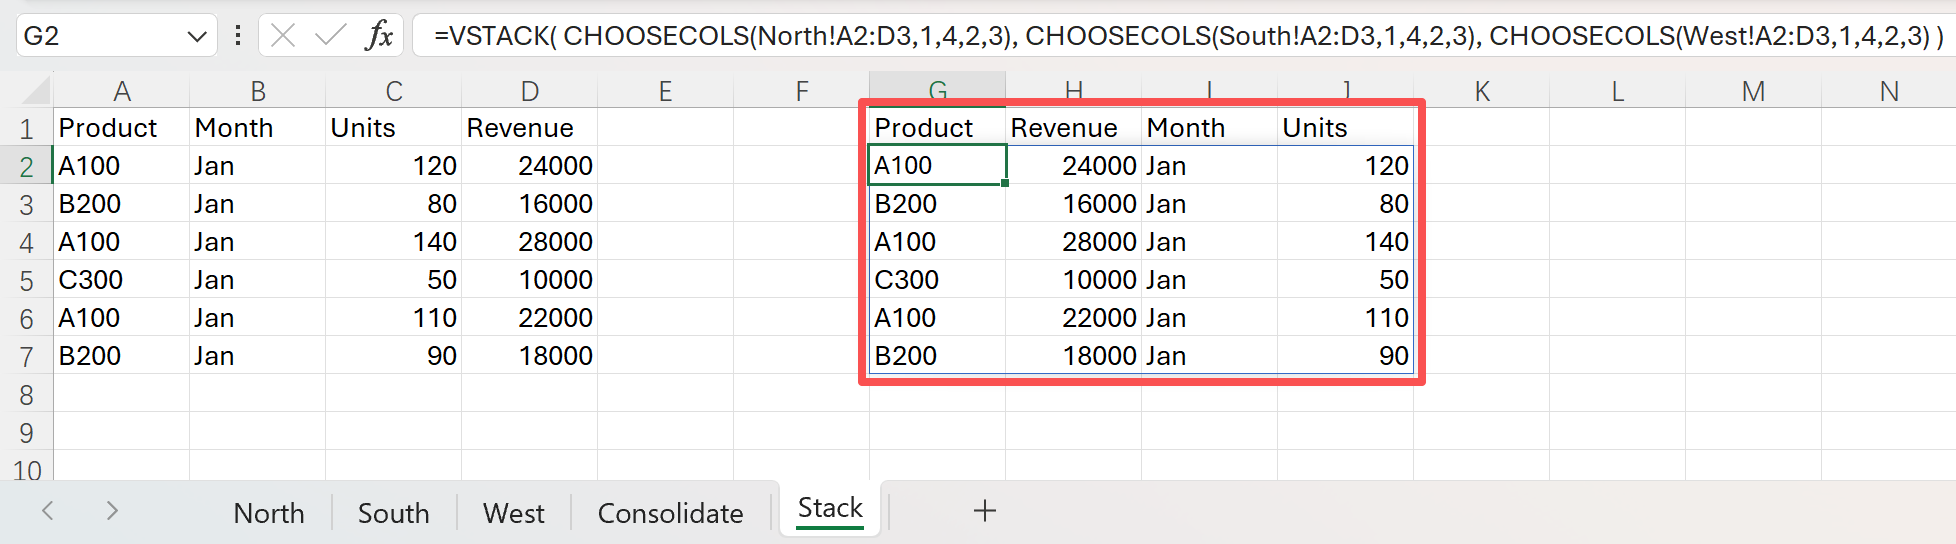
Align different column orders
If columns exist in a different order across sheets, select the same columns by header name and then stack:
=VSTACK( CHOOSECOLS(North!A2:D3,1,4,2,3), CHOOSECOLS(South!A2:D3,1,4,2,3), CHOOSECOLS(West!A2:D3,1,4,2,3) )
Do it faster with AskExcel
For simple, one-off merges, Excel formulas or the Consolidate command are perfectly adequate. When you face many sheets, mismatched columns, messy headers, or repeated monthly updates, AskExcel is a faster alternative. Upload your Excel or CSV files, describe what you want in plain language, and it returns a clean, combined worksheet ready for pivots and charts. No formulas to maintain, no manual steps to repeat.
Try prompts like:
- “Combine the North, South, and West sheets into one table. Keep the columns Product, Month, Units, Revenue, add a Region column, and remove blank rows.”
- “Merge Sales with Targets by Product. Bring in TargetUnits and Owner. Flag rows where Units exceed TargetUnits.”
- “Append all sheets whose names start with ‘2025_’ into a single dataset and remove duplicates by Product and Month.”
- “Create a summary by Product across all sheets with total Units and total Revenue. Include a top 10 chart by Revenue.”
- “Stack every table in this workbook, align columns by header name, and export a clean CSV.”
If you can describe the outcome, AskExcel can produce it and keep it consistent every time you refresh your data.
Putting it all together
- Need totals or averages across sheets: use Data > Consolidate.
- Want one long transactional table: stack with
VSTACKand helpers likeCHOOSECOLSandFILTER. - Need to bring columns from one sheet to another: use
XLOOKUP. - For recurring, messy, or multi-workbook merges: save time with AskExcel.
Pick the approach that fits your goal and the complexity of your data, then build your analysis on a single, reliable source of truth.