A p-value comes up any time you need to judge whether an observed difference or association is likely due to chance or reflects a real effect.
Typical situations include A/B testing for marketing campaigns, before/after comparisons for process changes, clinical or lab experiments, survey comparisons between segments, regression coefficient testing, contingency table comparisons for categorical data, quality-control checks, and any analysis where you will make decisions based on whether two means, proportions, variances, or model coefficients differ.
What a p-value actually tells you
Imagine you have a coin that you think is fair (50% heads, 50% tails). You flip it 10 times and get 9 heads.
- A p-value is like asking: “If this coin is actually fair, how likely is it to get results this crazy?”
- If the chance is very small, you start thinking: “Hmm… maybe this coin isn’t fair after all.”
- If the chance is big, then 9 heads in 10 flips could just happen by luck, so you don’t worry.
Another example:
You try a new game trick to see if it helps you win more. You play 20 rounds and win 15 times.
- The p-value tells you: “If the trick doesn’t really work, how likely is it to win this many times just by luck?”
- A small p-value → trick probably works.
- A big p-value → could just be random luck.
In short:
A p-value is just a number that tells you if what you saw is surprising or not if nothing special is happening.
Baseline dataset
Paste this into Excel or use it as a starting point. Cell addresses below assume the top-left of the first table is A1.
Campaign CTRs (for two-sample t-test)
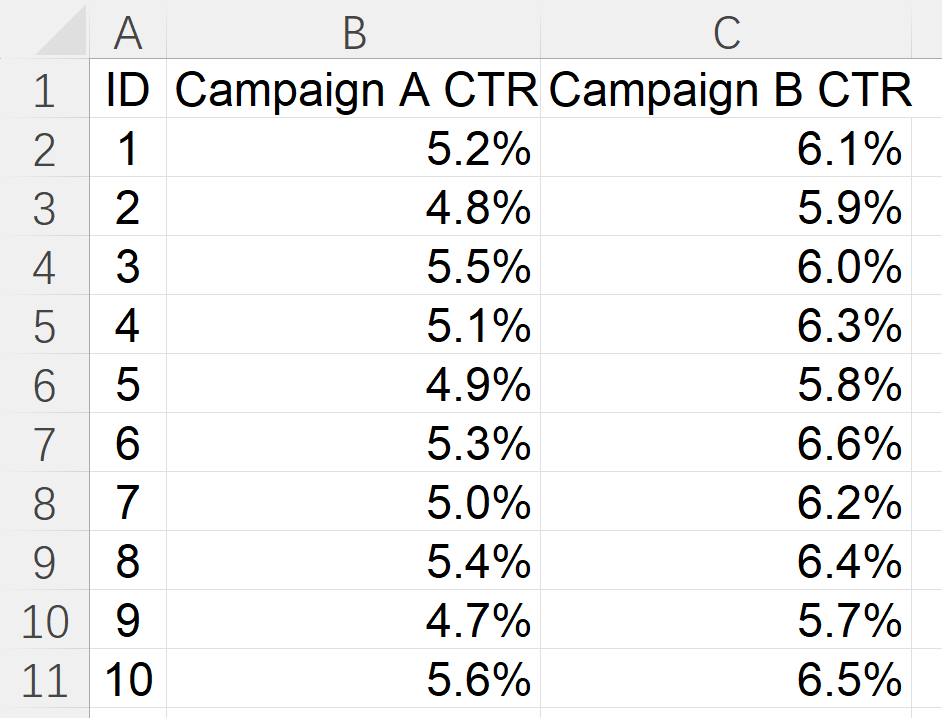
We will use these ranges in examples below. Replace them with your actual ranges.
Get a p-value with T.TEST for two samples
Use this when you compare two groups. T.TEST returns the p-value directly.
- Two-tailed, equal variances assumed:
=T.TEST(B2:B11, C2:C11, 2, 2) - Two-tailed, unequal variances (safer default in many A/B tests):
=T.TEST(B2:B11, C2:C11, 2, 3) - One-tailed versions change the third argument to 1:
=T.TEST(B2:B11, C2:C11, 1, 3)
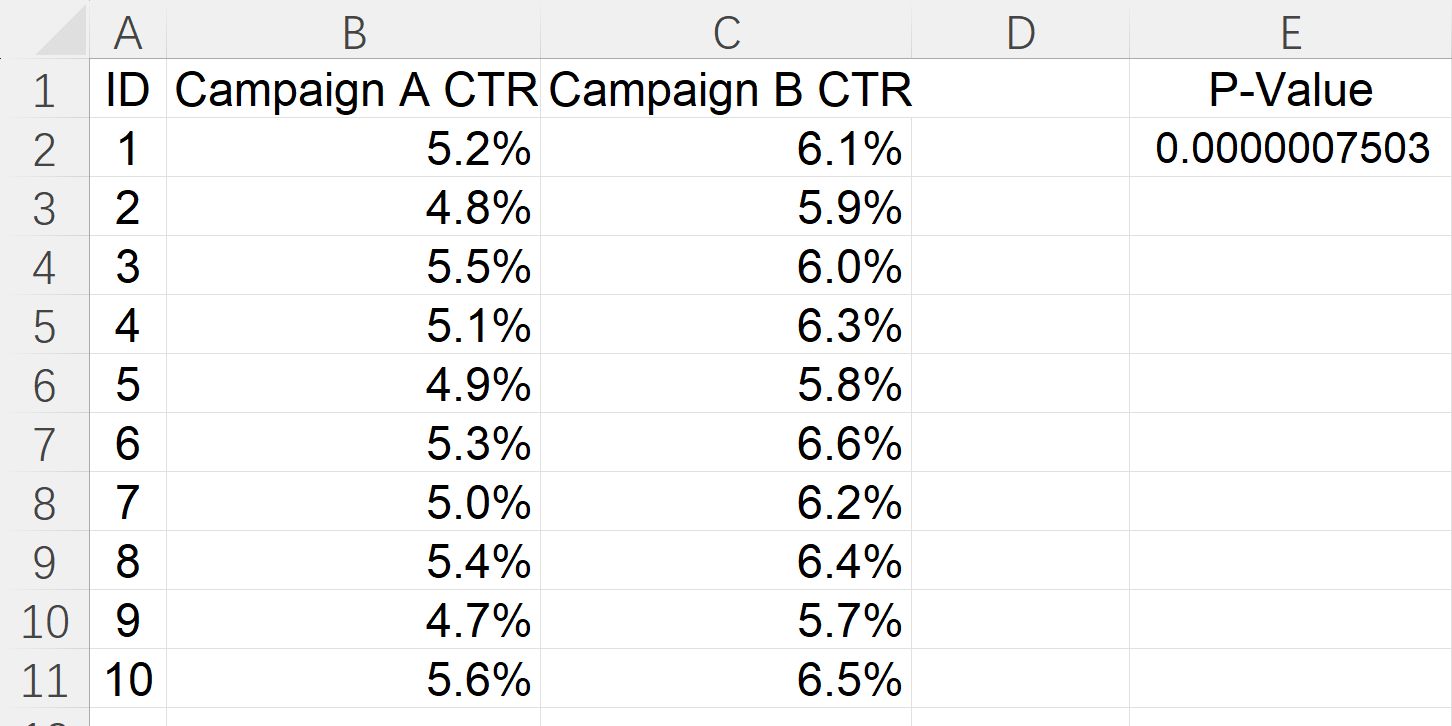
Now, wo got the p-value=0.0000007503. The p-value is vanishingly small, so we can confidently reject the null hypothesis that the two campaigns have the same CTR. In plain terms, the observed higher CTR for Campaign B is almost certainly not due to random chance.
Sometimes you may want to see the intermediate test statistic (the z-score) and convert it to a p-value yourself — for example when you know a population standard deviation or want to show the standardized result. If you search for how to find z score in excel, common methods are =STANDARDIZE(x, mean, stdev) or the manual formula =(x-mean)/STDEV.S(range) for sample-based calculations. After getting z, obtain a one-tailed p-value with =NORM.S.DIST(z, TRUE) or a two-tailed p-value with =2*(1-NORM.S.DIST(ABS(z), TRUE)). (Remember Z.TEST returns a one-tailed p-value, so double it for a two-tailed test.)
Tips:
If you are unsure about equal vs unequal variances, use type 3 (unequal) or check with
=F.TEST(B2:B11, C2:C11). A small F-test p-value suggests variances differ.Two-tailed is the default unless you had a directional hypothesis before seeing data.
Make it faster with AskExcel
For routine and slightly more advanced tasks, AskExcel saves time. Paste your ranges, and ask AskExcel to:
- pick the appropriate test,
- calculate the p-value,
- return the test statistic and degrees of freedom,
- produce interpretation text and suggested plot(s),
- run assumption checks like normality or equal variance tests,
- generate a concise report you can paste into slides or an email.
Example AskExcel prompt:
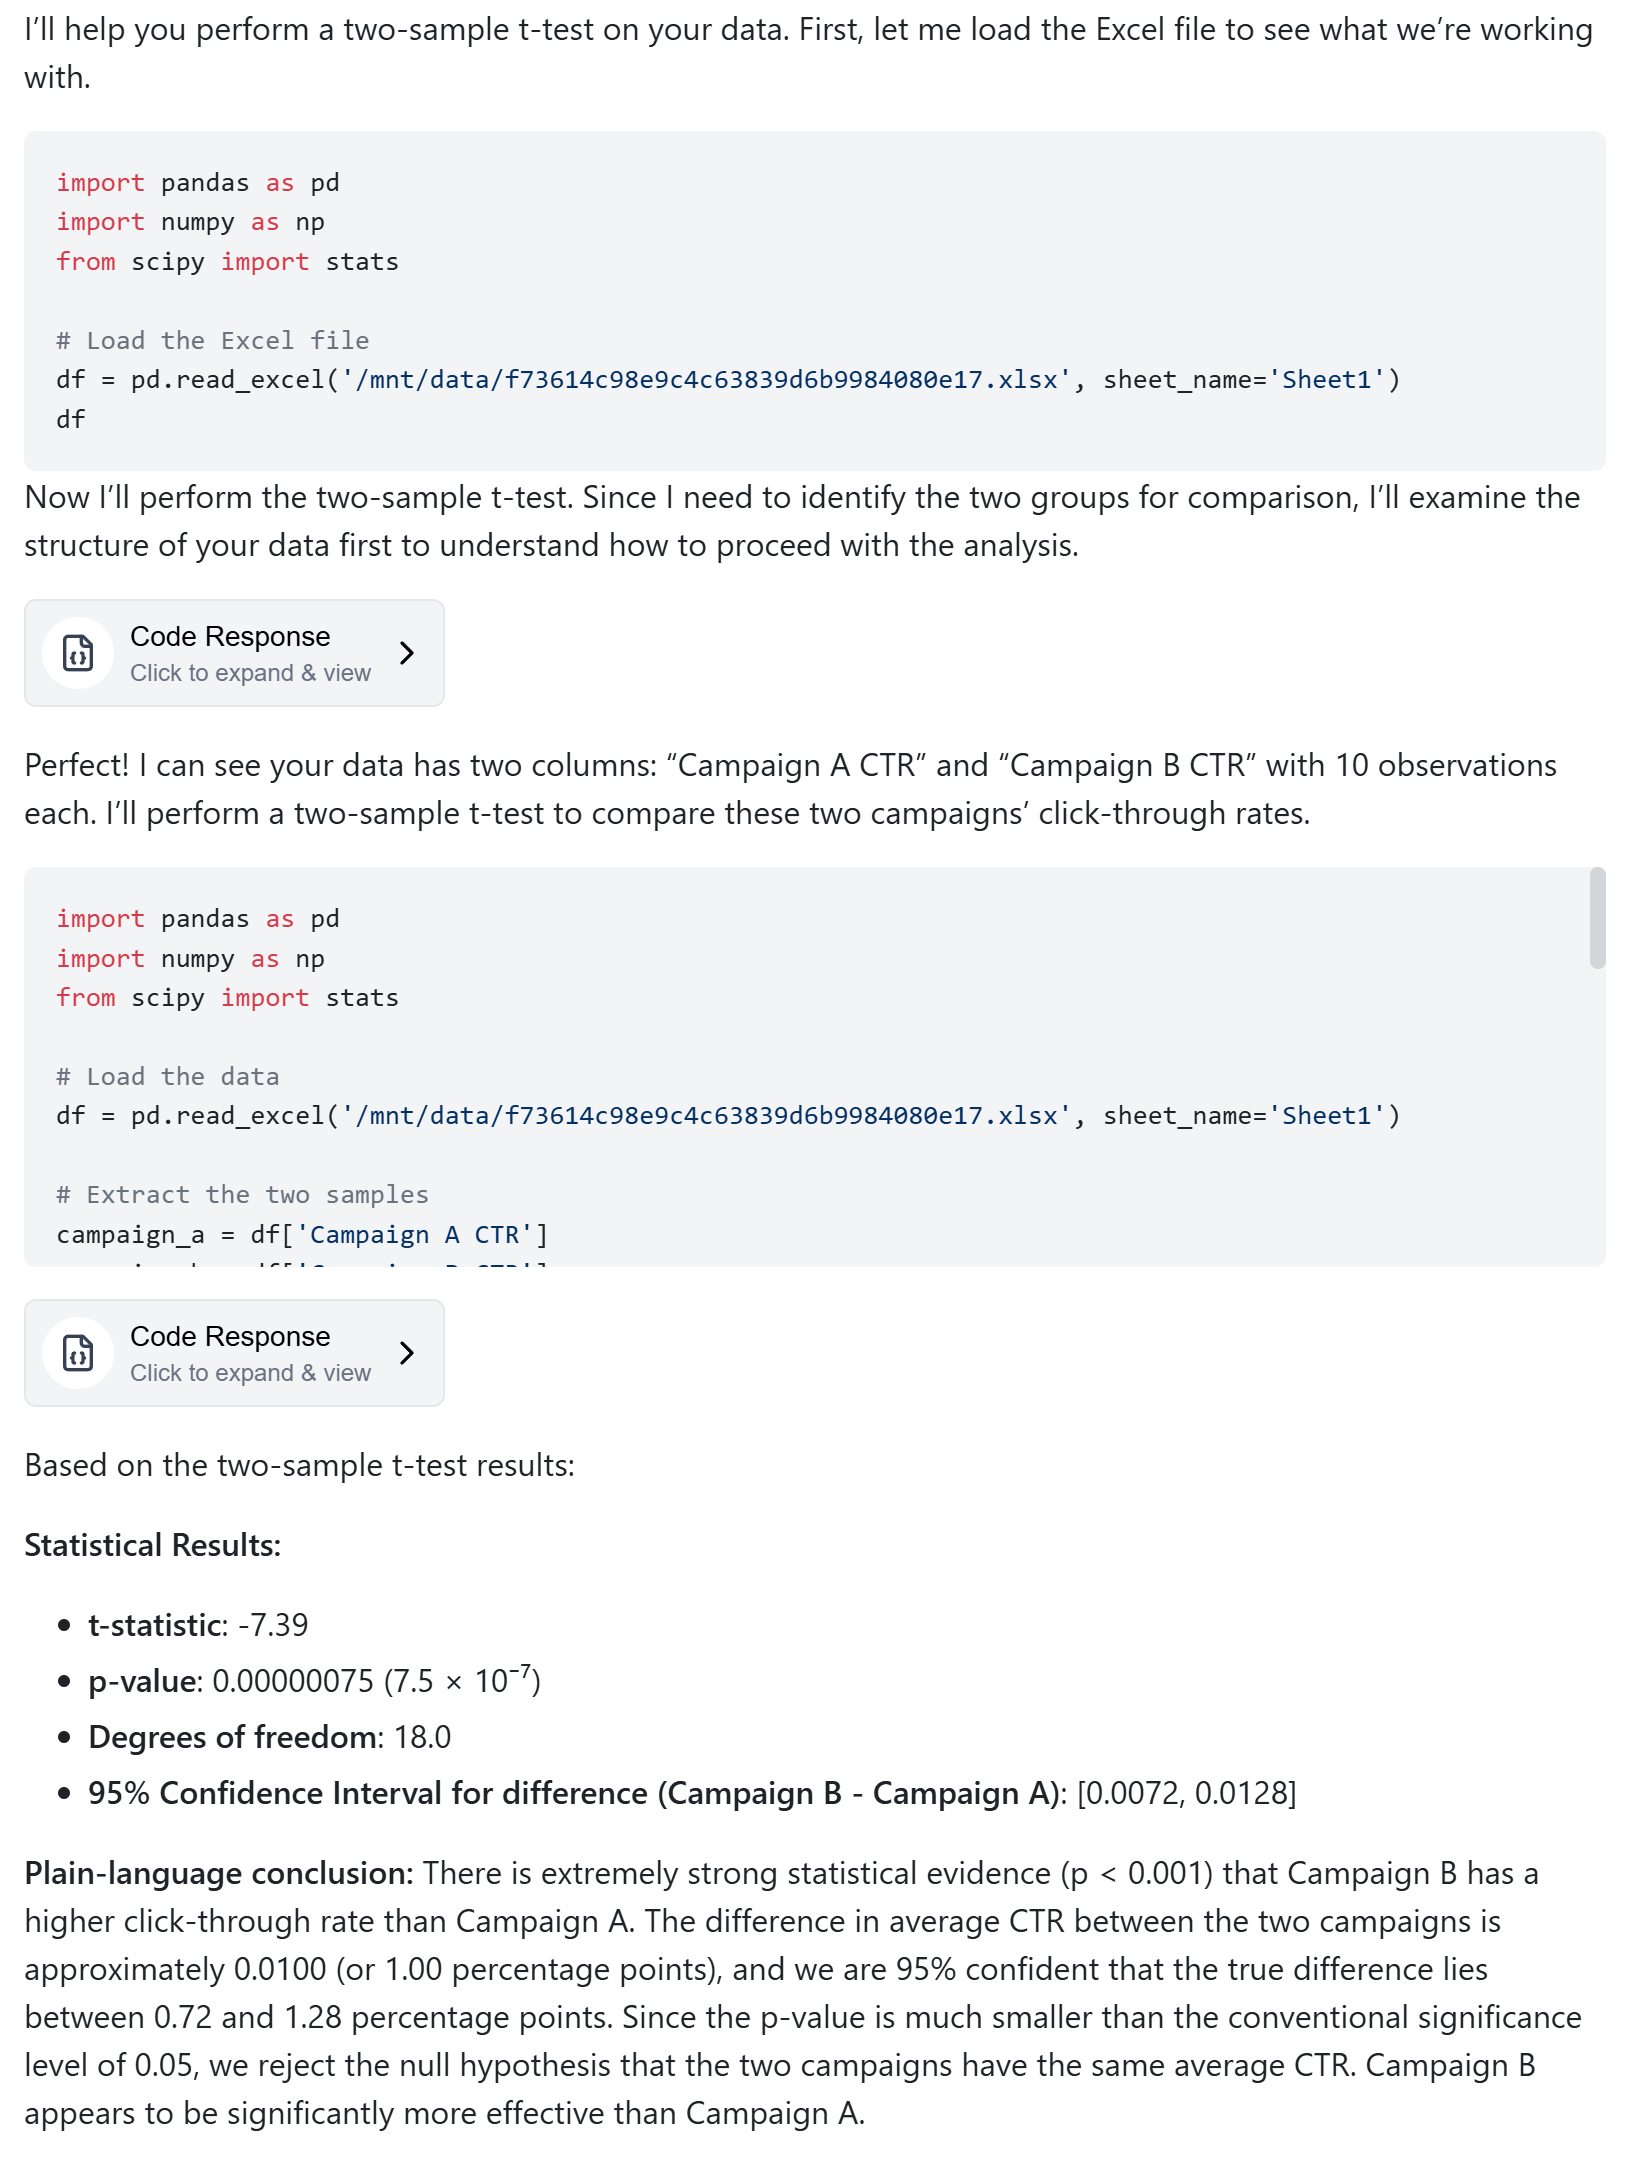
Compare B2:B11 and C2:C11 with a two-sample t-test (two-tailed). Return p-value, t-statistic, df, 95% CI for difference, and a plain-language conclusion.
AskExcel is especially handy when you have multiple comparisons, want automatic interpretation for stakeholders, or need reproducible reports without manual formula wiring.
Quick FAQ
Q. Which test should I choose, t-test or z-test?
A. Use t-tests in most practical situations unless you truly know the population standard deviation and have reason to use the z-approach.
Q. Do I need to halve or double p-values?
A. Understand whether your function returns a one-tailed or two-tailed p-value. T.TEST can return the correct two-tailed p-value directly when you set tails = 2. Z.TEST returns a one-tailed p-value so double it for a two-tailed test.
Q. What alpha should I use?
A. 0.05 is common, but choose the threshold based on domain conventions and the cost of false positives versus false negatives.
Wrap-up
You can get p-values in Excel several ways. T.TEST is usually the fastest for two-sample mean comparisons. The Data Analysis ToolPak offers full output, and manual calculations using T.DIST.2T or NORM.S.DIST give you complete transparency. If you want an even faster, guided, and repeatable workflow that validates assumptions and produces clear interpretations, try AskExcel to automate the steps and create polished output.