The interquartile range measures how spread out the middle 50 percent of your data is. It is simply Q3 minus Q1. Q1 is the 25th percentile and Q3 is the 75th percentile.
Real-world times you need the IQR:
- Pricing and costs: compare the core spread of product prices, bids, or supplier quotes without letting extreme values mislead you.
- Operations and logistics: understand delivery times or cycle times while downweighting rare delays.
- Finance and risk: summarize the central spread of returns or transaction sizes to spot stability changes.
- Healthcare and research: report the dispersion of lab results or trial measurements in a way that is robust to outliers.
- Education and HR: analyze test scores, performance ratings, or compensation bands.
- Quality control: monitor process variation and flag unusual runs.
- Real estate and travel: summarize rental rates, home prices, hotel nights, or airfare without being skewed by a few luxury entries.
- Data cleaning: detect outliers to review or filter before modeling or reporting.
IQR is popular because it is robust. It focuses on the heart of the data and reduces the impact of extremes.
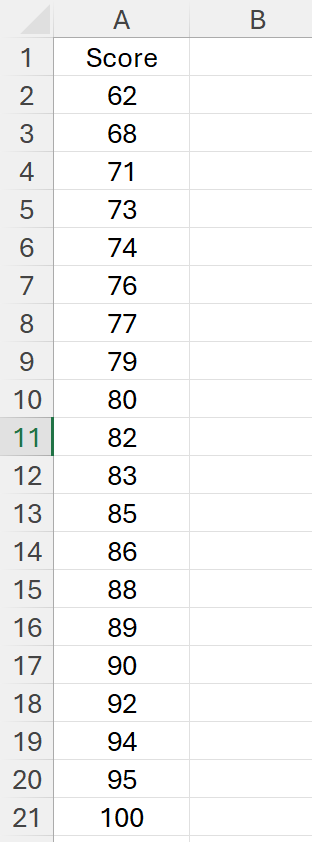
Sample data we will use
We will assume your numeric values are in A2:A21.
The fastest way to calculate IQR in Excel
There is no single IQR function, but you can compute it directly with quartile or percentile functions.
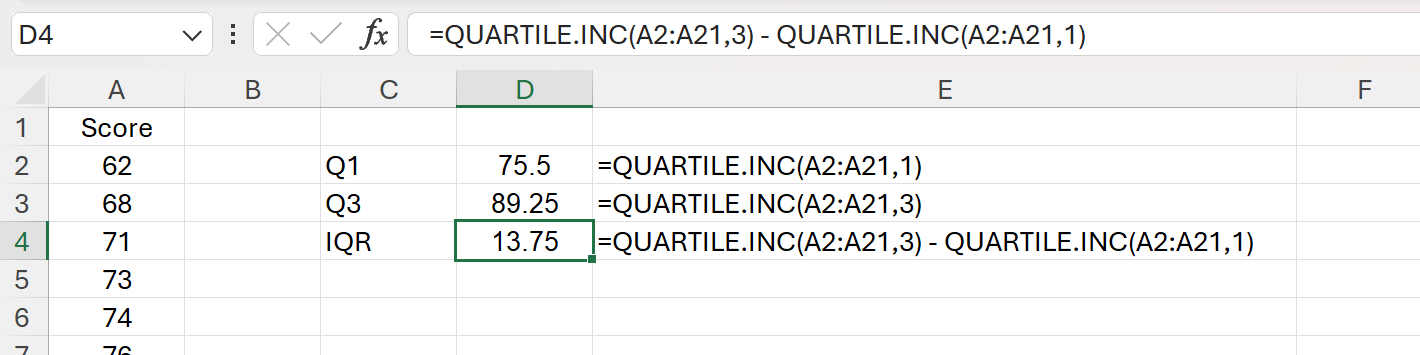
Method 1: Inclusive quartiles
Use the inclusive definition most people expect in reports.
- Q1:
=QUARTILE.INC(A2:A21,1) - Q3:
=QUARTILE.INC(A2:A21,3) - IQR:
=Q3_cell - Q1_cell
One-cell version: =QUARTILE.INC(A2:A21,3) - QUARTILE.INC(A2:A21,1)
With named steps using LET: =LET(rng,A2:A21, q1,QUARTILE.INC(rng,1), q3,QUARTILE.INC(rng,3), q3-q1)
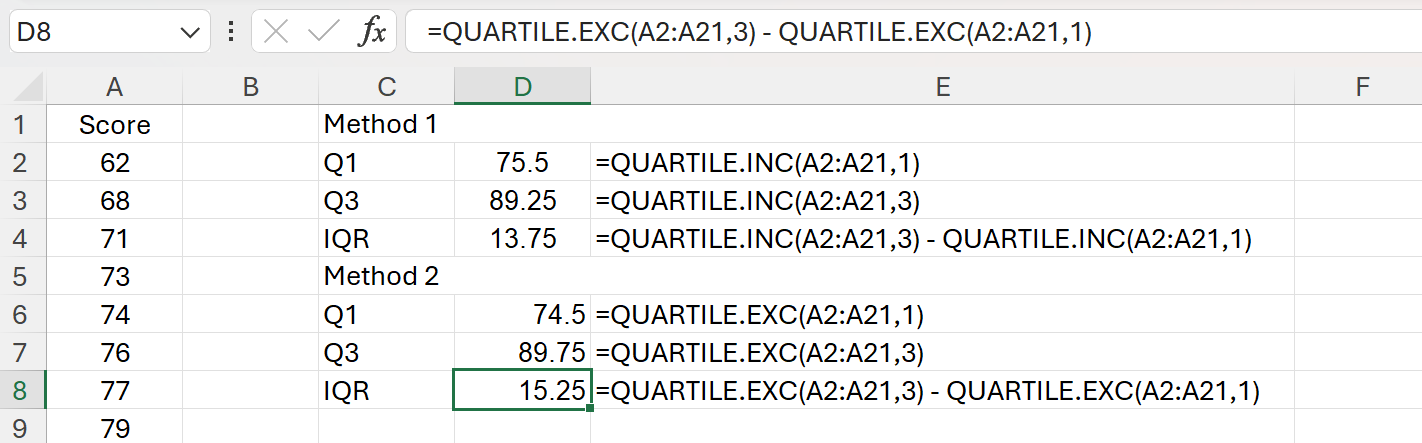
Method 2: Exclusive quartiles
If your method requires excluding the median in certain sample sizes, use:
- Q1:
=QUARTILE.EXC(A2:A21,1) - Q3:
=QUARTILE.EXC(A2:A21,3) - IQR:
=Q3_cell - Q1_cell
One-cell version: =QUARTILE.EXC(A2:A21,3) - QUARTILE.EXC(A2:A21,1)
Tip: For most business reporting, pick one convention and stick with it. Inclusive is more common.
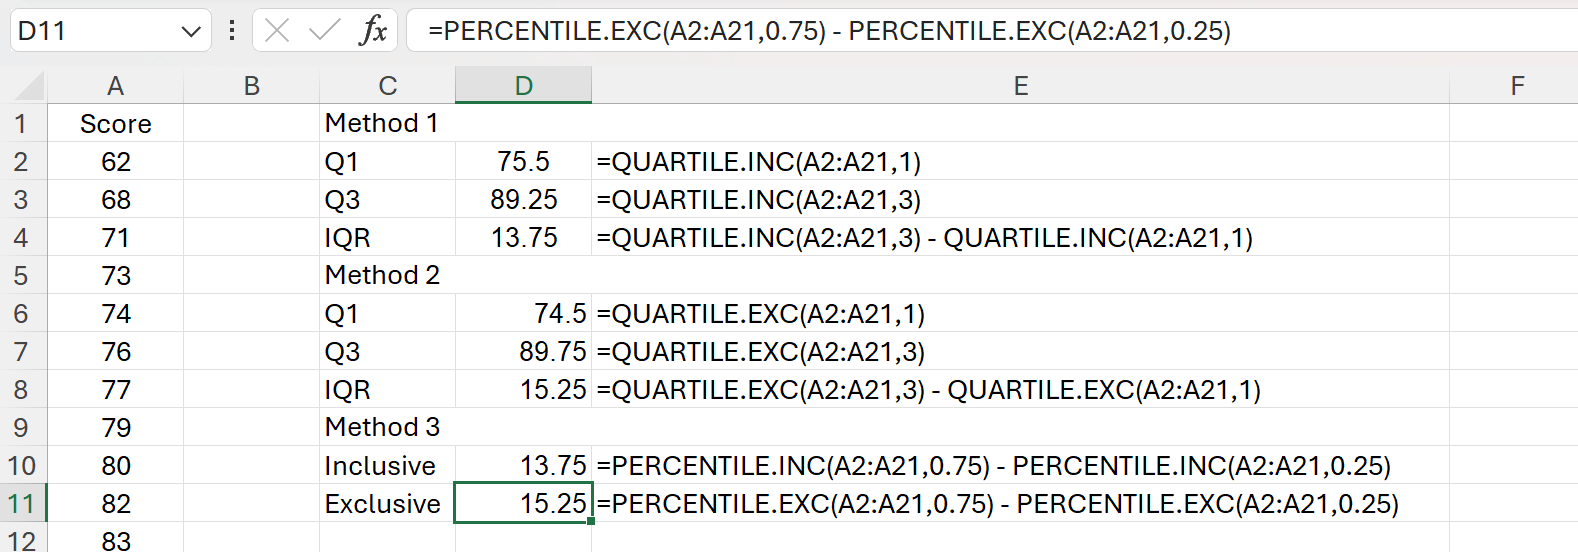
Method 3: Using percentiles
These return the same results as their quartile counterparts.
- Inclusive:
=PERCENTILE.INC(A2:A21,0.75) - PERCENTILE.INC(A2:A21,0.25) - Exclusive:
=PERCENTILE.EXC(A2:A21,0.75) - PERCENTILE.EXC(A2:A21,0.25)
Practical extras you will likely need
Flag outliers using the 1.5×IQR rule
- Calculate Q1, Q3, and IQR with any method above.
- Compute fences:
- Lower fence:
=Q1_cell - 1.5*IQR_cell - Upper fence:
=Q3_cell + 1.5*IQR_cell
- Lower fence:
- Mark outliers in a helper column:
=OR(A2<lower_fence_cell, A2>upper_fence_cell)
Use this to filter or to drive conditional formatting.
Common gotchas
- Blanks are ignored, zeros are not. If zeros are placeholders you want to exclude, use:
=QUARTILE.INC(FILTER(A2:A21, A2:A21<>0),1)
- Text in the range will cause errors. Keep the range numeric or wrap with
FILTER(A2:A21,ISNUMBER(A2:A21)). - Small datasets can behave differently under exclusive quartiles. If replicating a specific textbook or standard, confirm which definition it uses.
When Excel formulas are perfect vs when to use AskExcel
For a single column, the formulas above are quick. When it gets complex, writing and maintaining formulas becomes time consuming. Examples:
- You need IQR by group, like Region, Product, or Month.
- You want to filter invalid values, calculate fences, and remove outliers before the IQR.
- You need a box and whisker chart for each category and a summary table.
- You want a clean audit trail that explains what happened to the data.
AskExcel lets you upload your file and type what you want in plain language. It handles the steps for you and returns results, charts, and an explanation. No formulas required.
Example prompts you can copy into AskExcel:
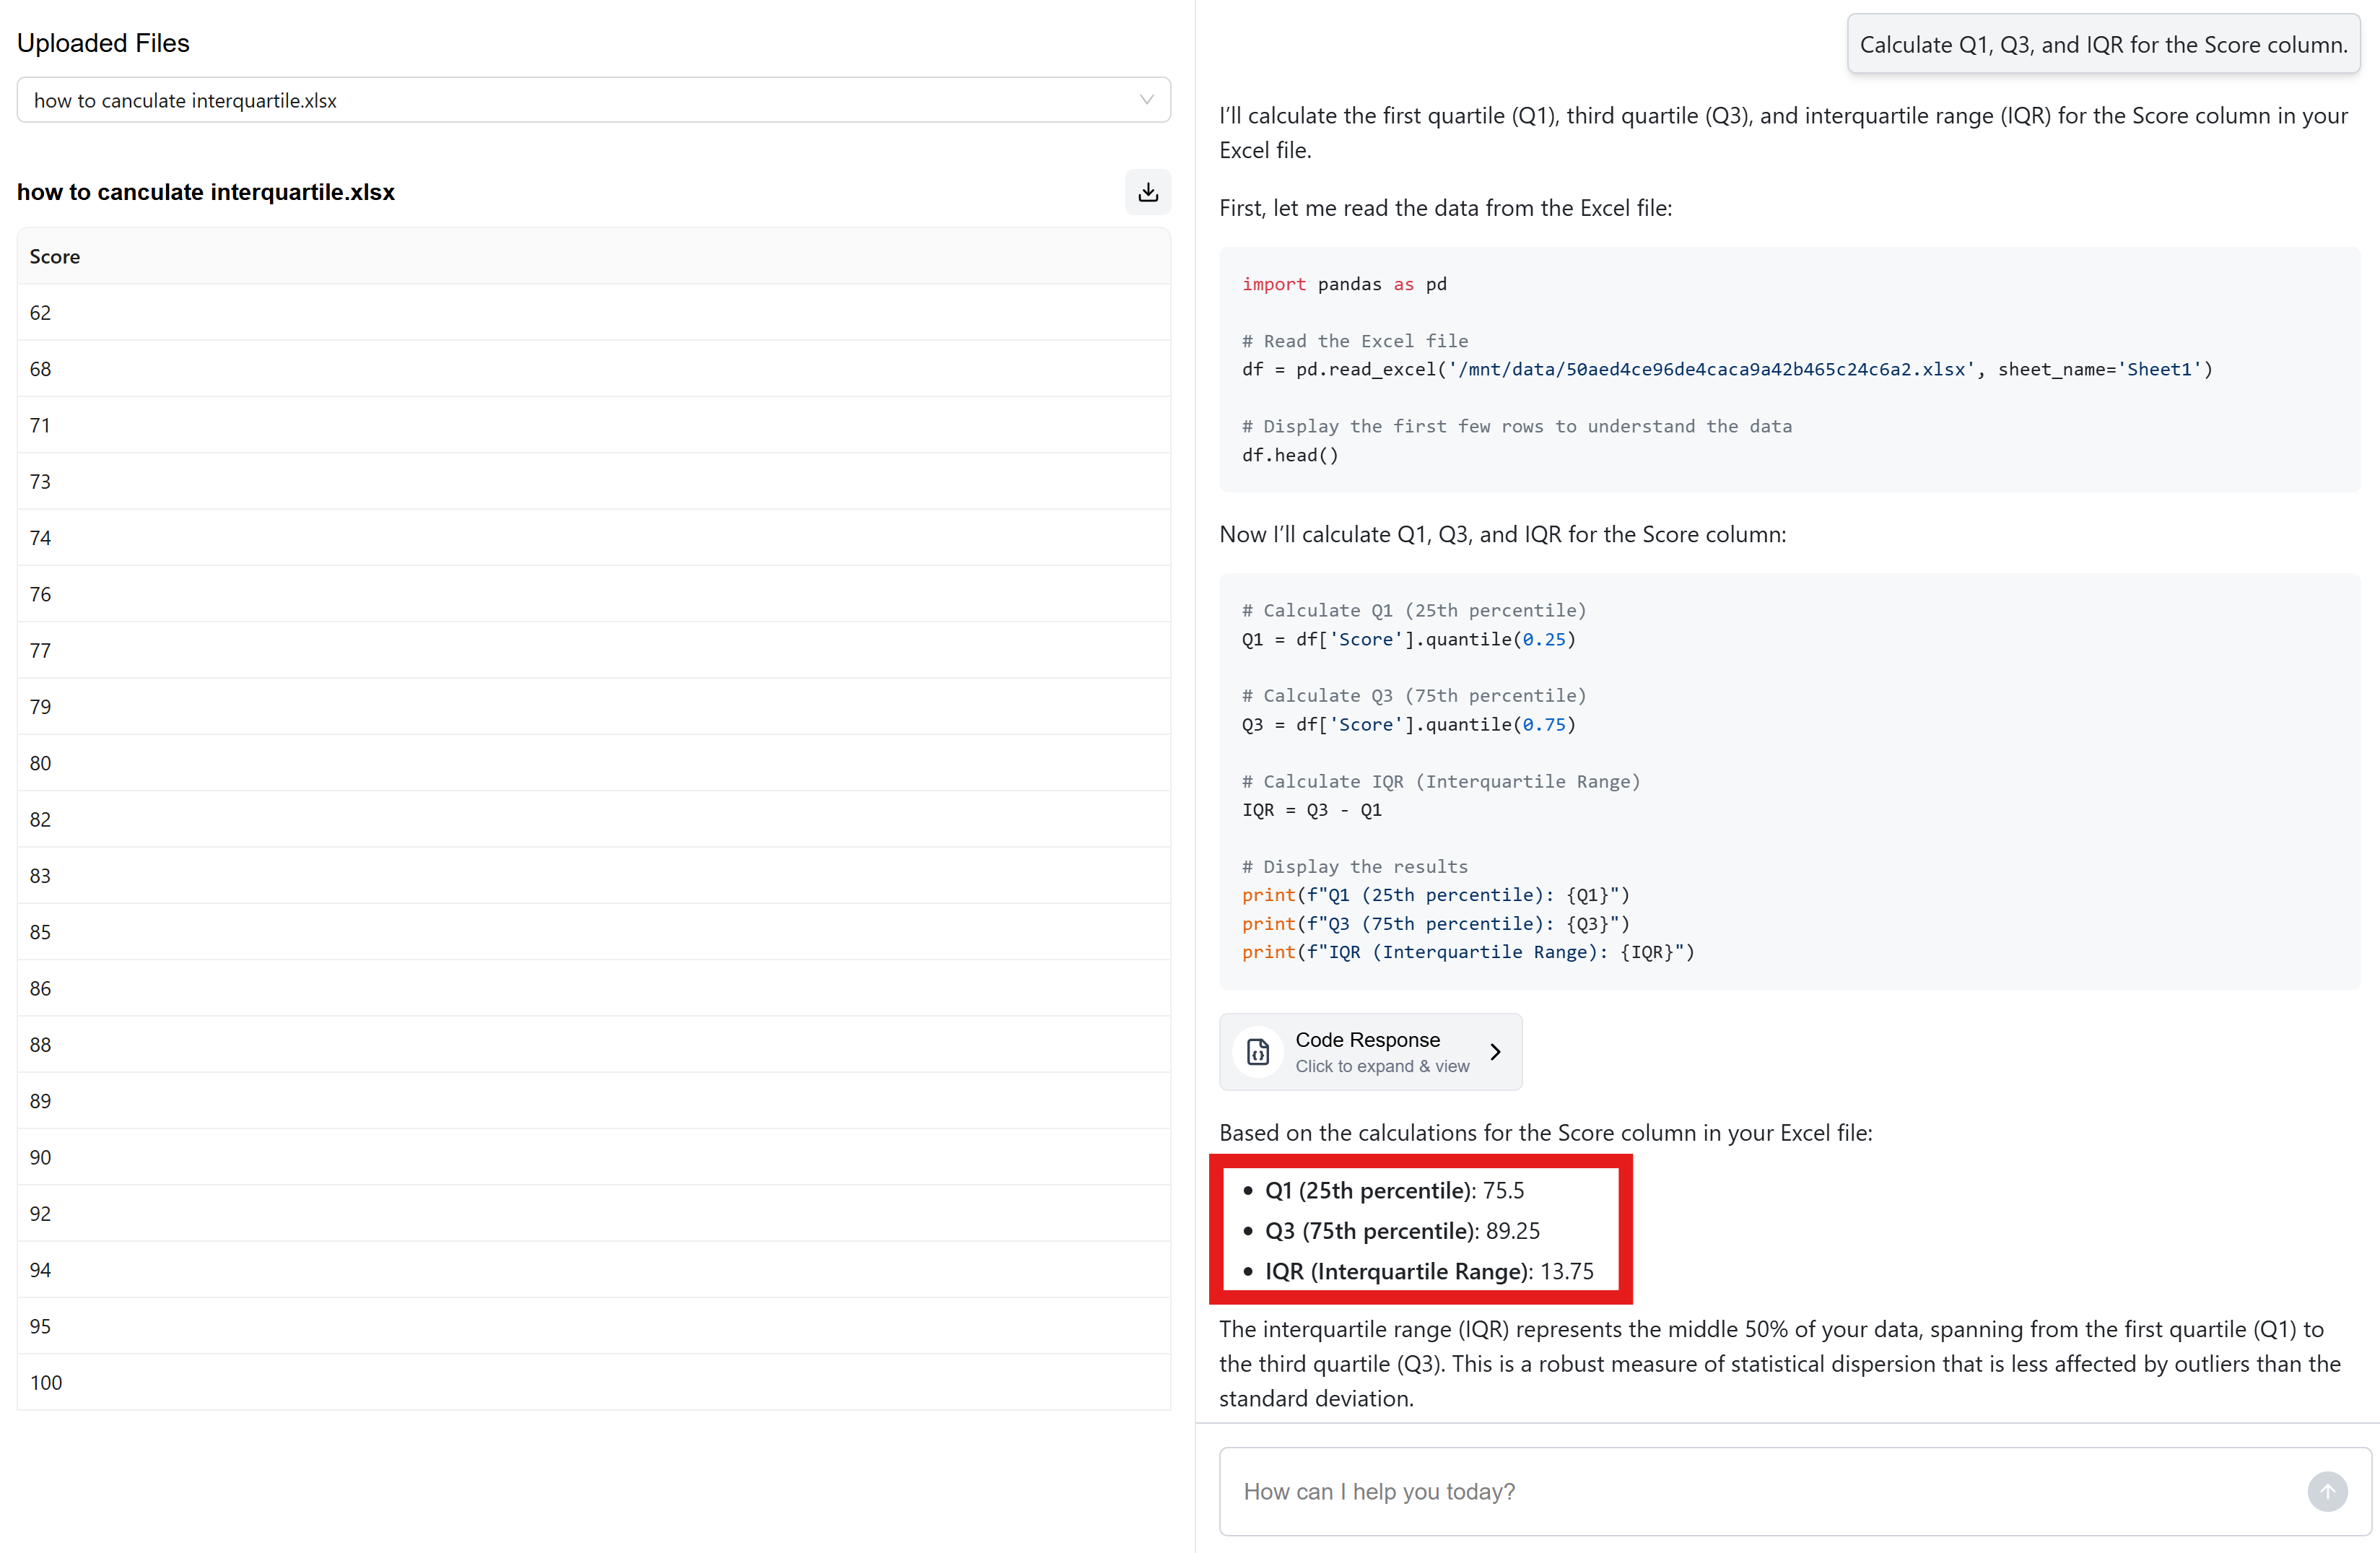
“Calculate Q1, Q3, and IQR for the Score column.”
“By Class, compute Q1, Q3, and IQR for Score and sort by IQR descending.”
“Remove outliers in Score using the 1.5×IQR rule, then report the mean and median by Class.”
“Create a box plot of Delivery Days by Carrier and label Q1, Median, Q3, and outliers.”
“Ignore blanks and negative values, then calculate the IQR of Amount.”
“Group by Month and show Q1, Median, Q3, and IQR for Sales with a summary chart.”
“Flag rows where Price is outside the IQR fences and export the clean dataset.”
Try AskExcel to do complex IQR analysis in minutes: https://askexcel.cc