Before diving into step-by-step instructions, consider when and why you need to compare Excel spreadsheets. This helps you pick the right method.
Scenarios where comparing spreadsheets is useful
- Version control for reports: verify what changed between last week's and this week's financial reports.
- Inventory reconciliation: find which SKUs were added, removed, or had quantity/price changes between two warehouse exports.
- Data imports and system migrations: confirm that a new CRM import matches the original dataset and identify missing records.
- Audit trails: create a clear list of changes for auditors or managers showing what was modified and by how much.
- Merging vendor lists: reconcile supplier or customer lists to build a single master list without duplicates.
- Contract or price updates: detect price changes across supplier or product lists.
- Data validation after transformations: ensure Power Query or other transformations did not unexpectedly alter values.
- QA for collaborative workbooks: track edits made by colleagues in separate copies before combining changes.
Fundamental dataset (use this example throughout the tutorial)
Below are two simple sheets you can paste into Excel for practice. Treat Sheet1 as "Inventory_Jan" and Sheet2 as "Inventory_Feb".
Sheet1 - Inventory_Jan
| ID | Product | Price | Stock | LastUpdated |
|---|---|---|---|---|
| 101 | Blue Widget | 12.50 | 100 | 2025-01-10 |
| 102 | Red Widget | 9.99 | 50 | 2025-01-09 |
| 103 | Green Widget | 15.00 | 20 | 2025-01-08 |
| 104 | Yellow Widget | 8.75 | 0 | 2025-01-07 |
| 105 | Black Widget | 20.00 | 10 | 2025-01-10 |
Sheet2 - Inventory_Feb
| ID | Product | Price | Stock | LastUpdated |
|---|---|---|---|---|
| 101 | Blue Widget | 12.50 | 95 | 2025-02-11 |
| 102 | Red Widget | 10.99 | 50 | 2025-02-08 |
| 103 | Green Widget | 15.00 | 20 | 2025-02-07 |
| 106 | White Widget | 11.00 | 30 | 2025-02-10 |
| 105 | Black Widget | 20.00 | 12 | 2025-02-11 |
Context and assumptions
- Both sheets share the same primary key column "ID" in column A starting at row 2.
- Columns B:E contain attributes you want to compare (Product, Price, Stock, LastUpdated).
- You want to detect rows that were added, removed, or updated, and identify which columns changed.
Methods to compare spreadsheets
Below are several common approaches, from quick visual checks to robust automated comparisons. Choose the one that fits your dataset size and complexity.
Manual side-by-side visual comparison
Best for: small lists where you just want a quick look.
- Open both workbooks and in Excel go to View > View Side by Side to place windows next to each other.
- Use Freeze Panes on the header row to keep column headings visible while you scroll.
- This is quick but error prone for larger datasets.
Using formulas to flag missing and changed rows
Best for: medium-sized tables, familiar with formulas.
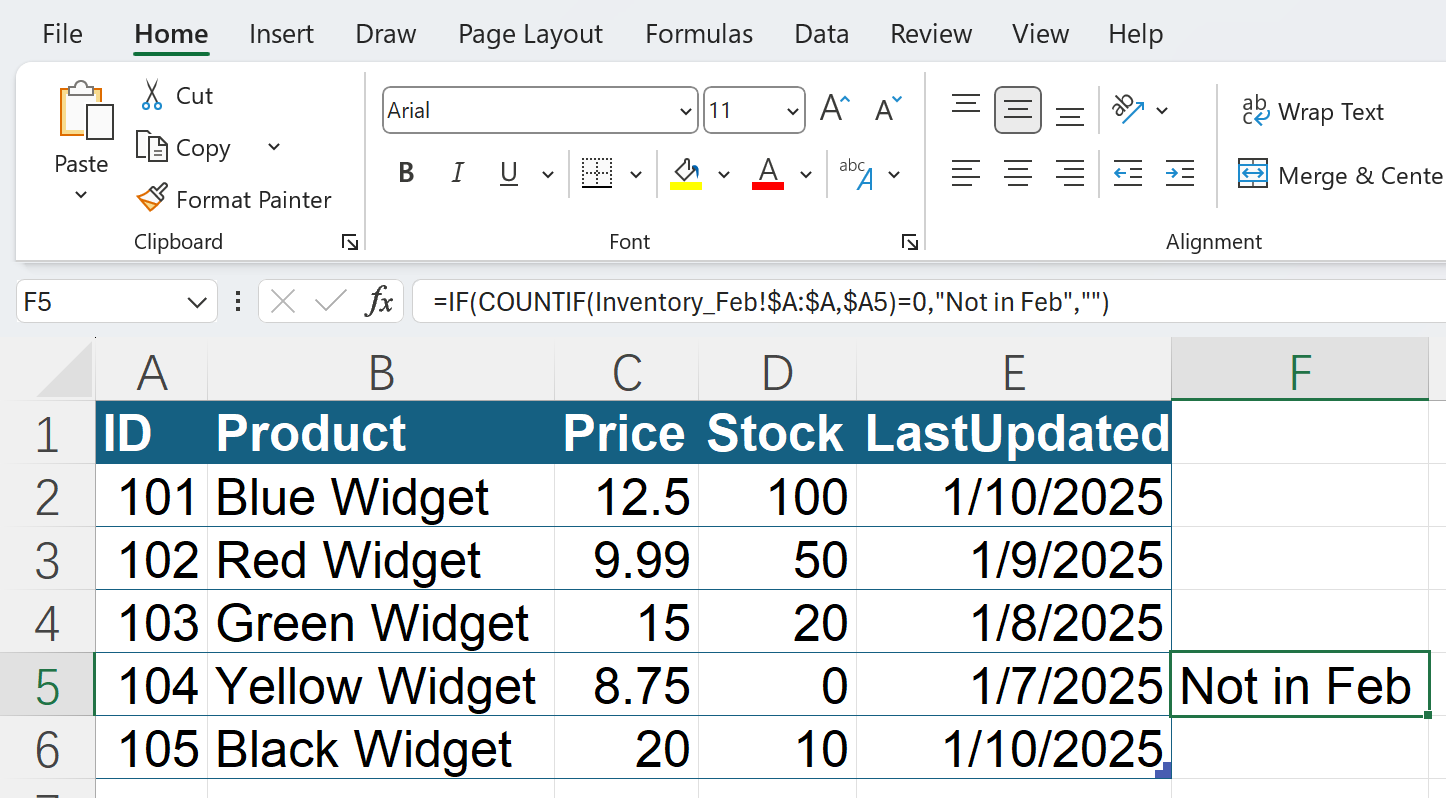
1) Flag rows in Sheet1 that do not exist in Sheet2 (by ID)
Assuming IDs in Sheet1 are in A2:A100, use a helper column in Sheet1 (column F) with:=IF(COUNTIF(Inventory_Feb!$A:$A,$A2)=0,"Not in Feb","")
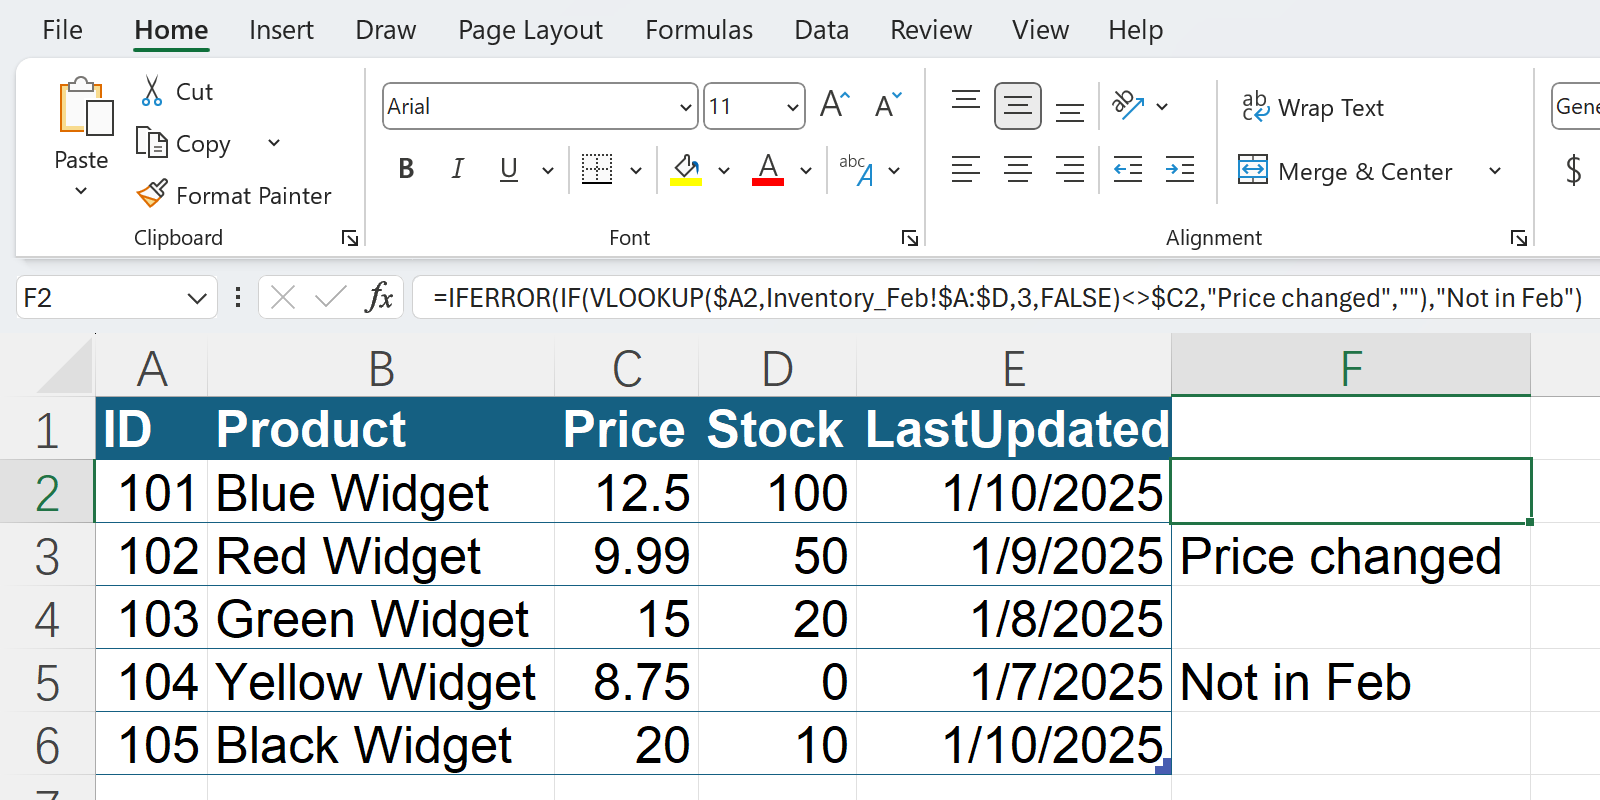
2) Check if a value changed for a matching ID using VLOOKUP
To check if Price in Sheet1 (column C) differs from Sheet2:=IFERROR(IF(VLOOKUP($A2,Inventory_Feb!$A:$D,3,FALSE)<>$C2,"Price changed",""),"Not in Feb")
3) Modern XLOOKUP version (more readable)
=IFERROR(IF(XLOOKUP($A2,Inventory_Feb!$A:$A,Inventory_Feb!$C:$C)<>$C2,"Price changed",""),"Not in Feb")
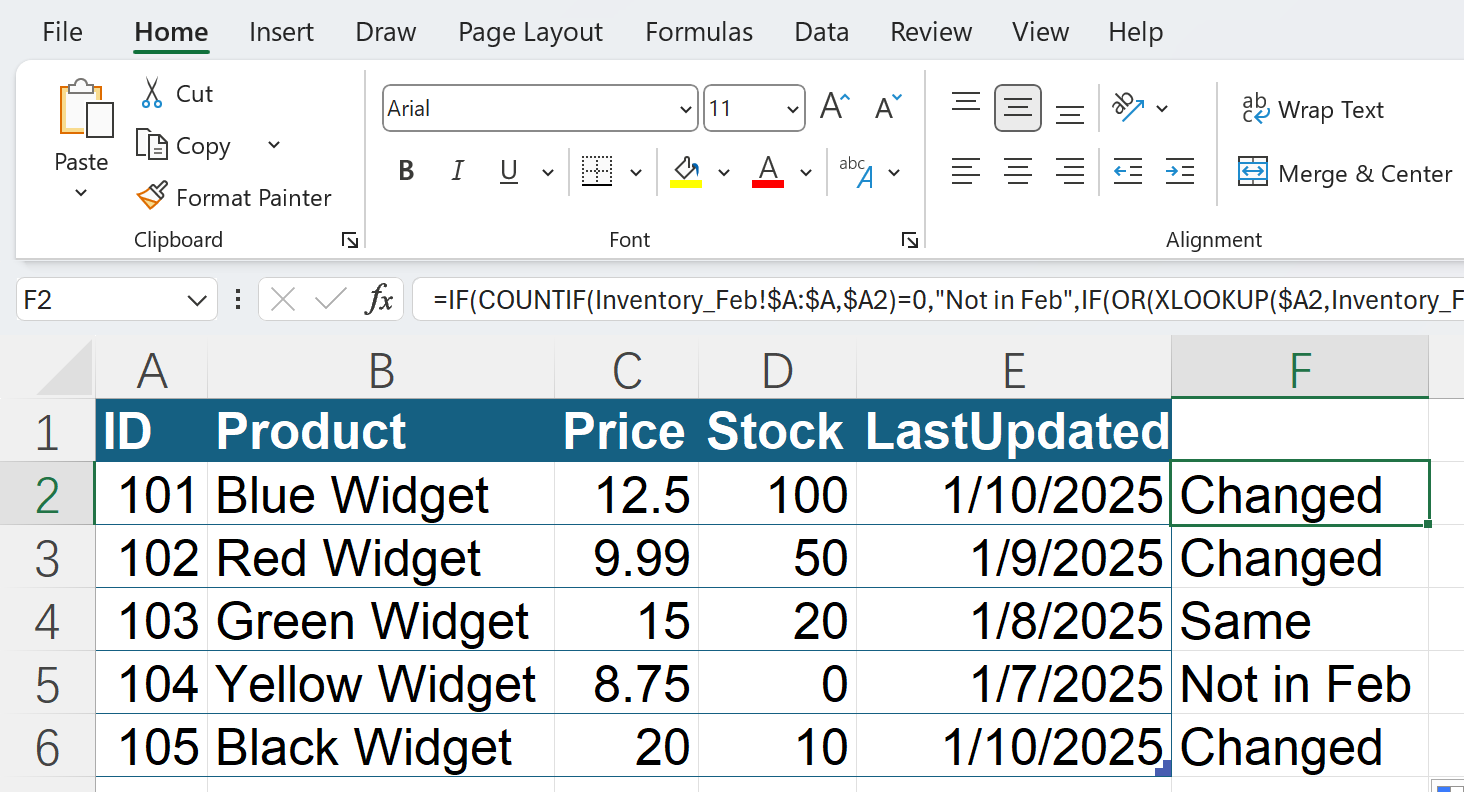
4) Compare multiple columns at once
Create a concatenated key or compare each column and combine results:=IF(COUNTIF(Inventory_Feb!$A:$A,$A2)=0,"Not in Feb",IF(OR(XLOOKUP($A2,Inventory_Feb!$A:$A,Inventory_Feb!$B:$B)<>$B2,XLOOKUP($A2,Inventory_Feb!$A:$A,Inventory_Feb!$C:$C)<>$C2,XLOOKUP($A2,Inventory_Feb!$A:$A,Inventory_Feb!$D:$D)<>$D2),"Changed","Same"))
Conditional formatting to highlight differences
Best for: visual scans within a sheet.
- Select the range in Sheet1 you want to format (for example
A2:E6). - Create a New Rule > Use a formula to determine which cells to format.
- Examples:
- Highlight rows not found in Sheet2:
=COUNTIF(Inventory_Feb!$A:$A,$A2)=0 - Highlight Price changes:
=IFERROR(XLOOKUP($A2,Inventory_Feb!$A:$A,Inventory_Feb!$C:$C)<>$C2,TRUE)
- Highlight rows not found in Sheet2:
- Choose a formatting color and apply. This will visually flag rows/values that need attention.
Using PivotTables and reconciliation counts
Best for: quick counts and summaries.
- Create a combined table with a source column that indicates Jan or Feb.
- Make a PivotTable with ID on rows and Source on columns and count of IDs.
- IDs with count 1 in one source and 0 in the other show added/removed.
- This is good for quick inventory reconciliation.
Use an AI comparison tool (recommended for complex, messy or large comparisons)
Best for: when your sheets have many columns, messy data, or you want a fast, summarized report.
Why consider AskExcel
AskExcel lets you upload 2 Excel files (or 2 sheets in 1 file), then describe in plain language what comparison you want. AskExcel will process both sheets and return:
- Lists of added, removed, and changed rows.
- A column-level change log showing old and new values.
- A summary dashboard with counts like Added = 1, Removed = 1, Changed = 3.
- Visualizations such as bar charts for types of changes, and downloadable difference files ready for review.
Example AskExcel prompts you can use
Compare Inventory_Jan and Inventory_Feb. Show rows added, removed, and any rows where Price or Stock changed. Include old and new values for changed rows.
Generate a summary of differences between the two sheets and give me a CSV of only changed rows.
Highlight IDs present in Feb but not in Jan, and flag rows where price increased by more than 1.00.
Why AskExcel helps
- You do not need to write formulas.
- It is faster for complicated comparisons and provides a readable, shareable report.
- Use it when manual formulas become tedious or error prone.
Putting it all together: a practical workflow
- Start with a quick side-by-side or PivotTable summary to understand the scale of differences.
- If the dataset is small, add helper columns and use XLOOKUP or VLOOKUP formulas to flag changes.
- If the task is complex or you want immediate, detailed insight, upload both files to AskExcel and ask for a differences report. AskExcel will handle the heavy lifting and return a clear, exportable result.
Final recommendation
For quick checks, formulas and conditional formatting work well. For repeatable, auditable or large-scale comparisons, use AskExcel. AskExcel is particularly useful when you want a fast, human-readable differences summary, downloadable reports, and helpful visuals without building formulas or queries yourself.