If you work with samples and want to say how precisely your sample mean represents the population, the standard error of the mean (SEM) is the best tool. Here are common situations where SEM is useful:
Scientific experiments comparing group means
Clinical trials summarizing patient outcomes by treatment arm
A/B tests measuring lift between variants
Manufacturing QA summarizing repeated measurements from a lot
Survey research reporting the mean score with uncertainty
Finance and forecasting when you’re averaging multiple periods
Education analytics summarizing test scores across classes or schools
Marketing campaign analysis comparing average conversions by channel
Operations benchmarking store or branch performance
Product analytics summarizing average session time or NPS by cohort
Supply chain monitoring average lead time by vendor
Any report that charts averages and needs error bars to show precision
The sample data we’ll use
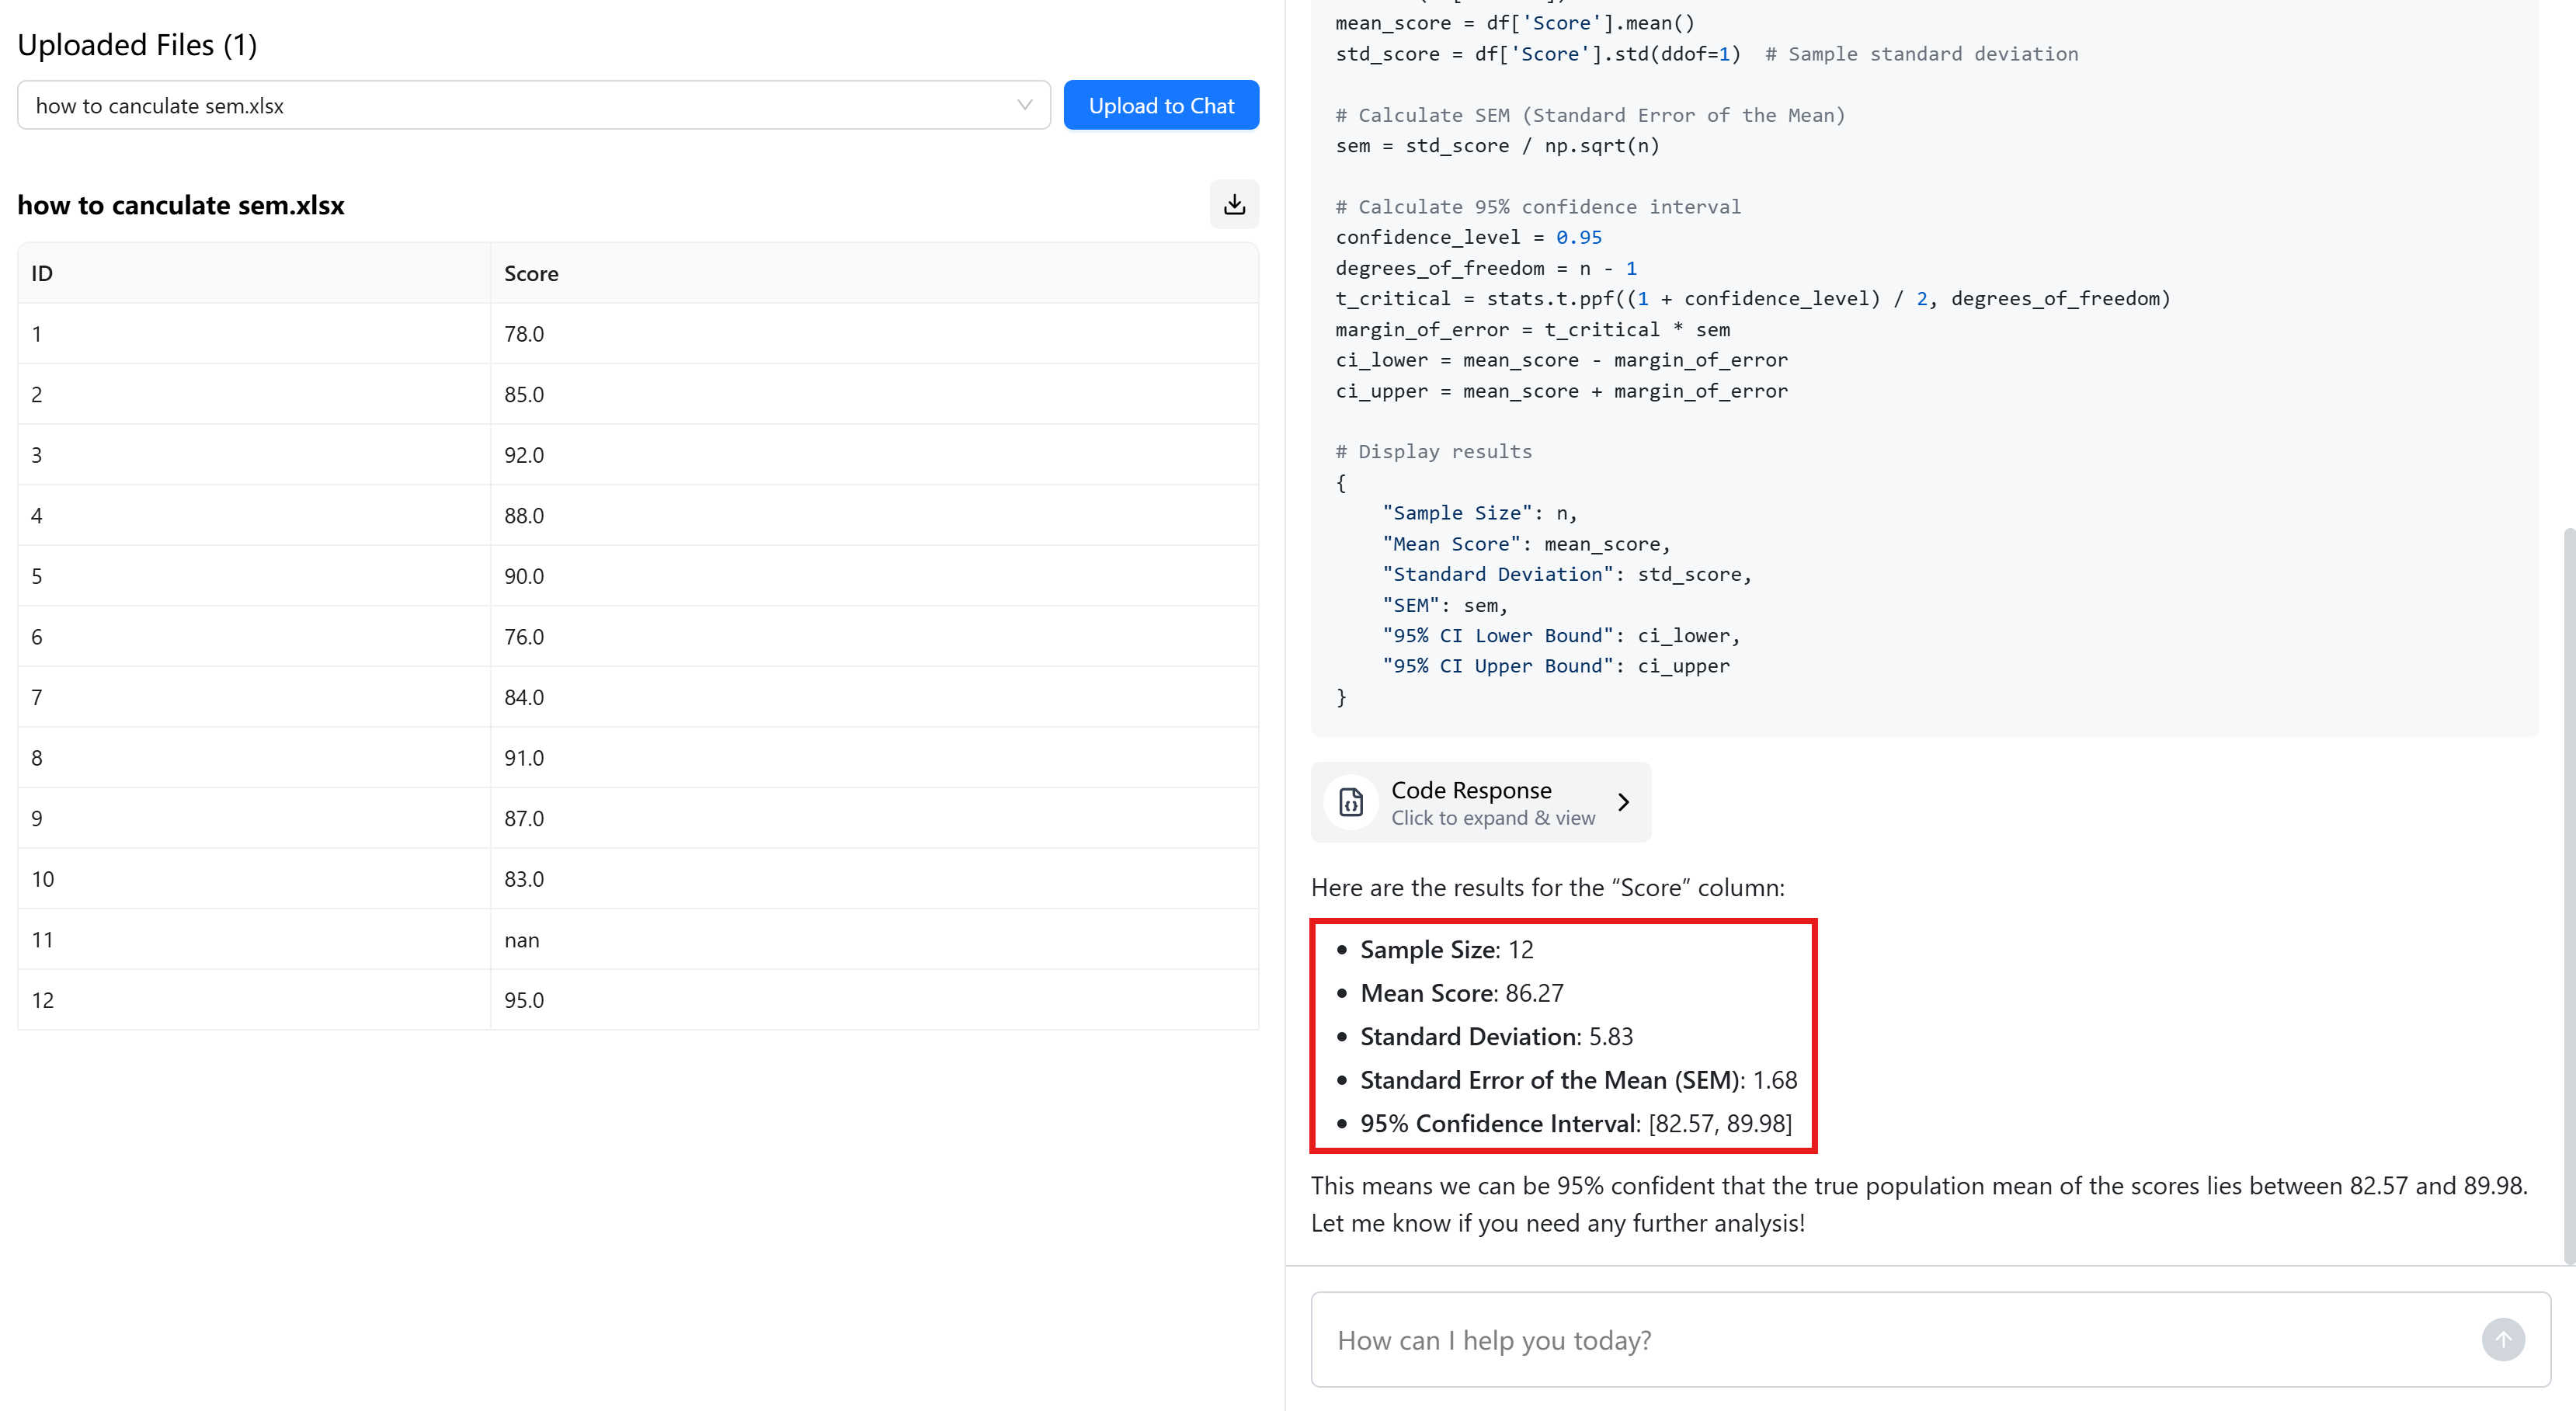
To make this concrete, here’s a small dataset of exam scores. We’ll compute the SEM for the Score column.
ID
Score
1
78
2
85
3
92
4
88
5
90
6
76
7
84
8
91
9
87
10
83
11
12
95
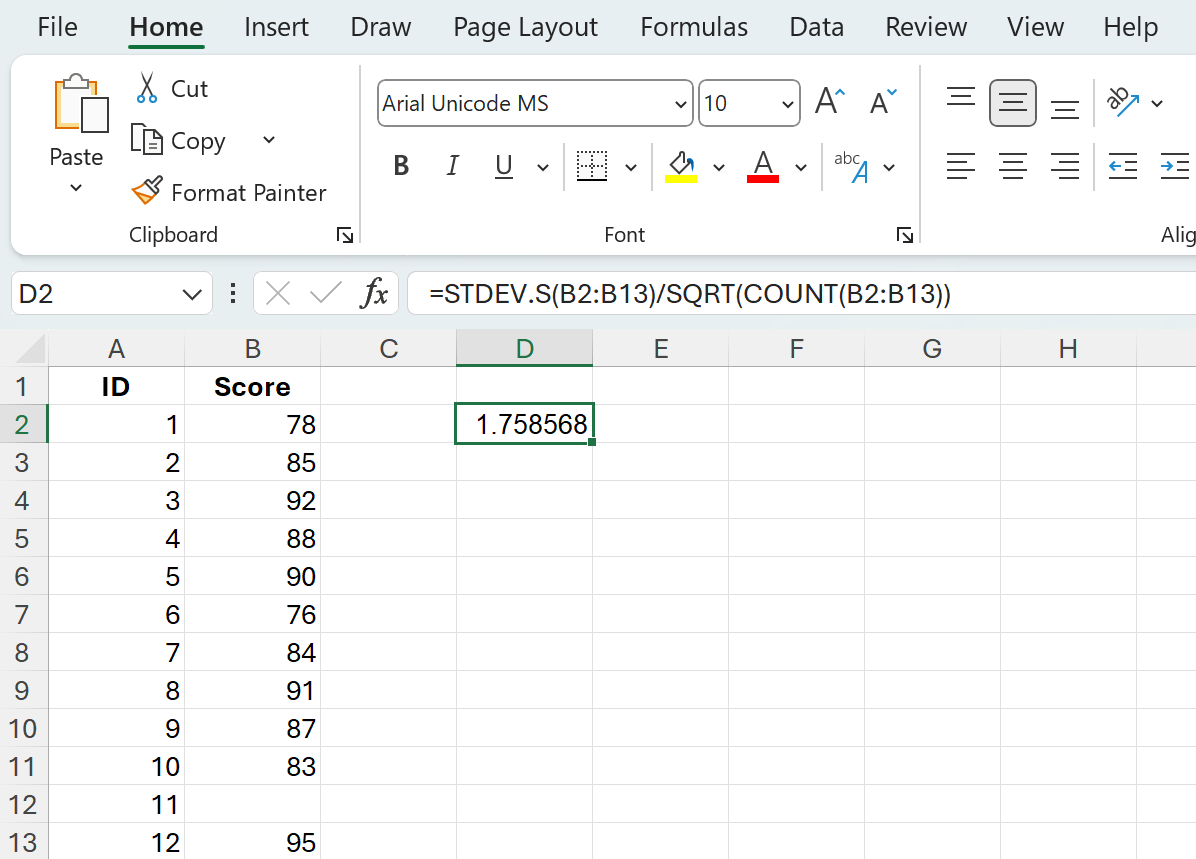
Assume this data sits in A1:B13 with headers in row 1 and the scores in B2:B13.
Quick SEM formula in Excel
SEM is the standard deviation divided by the square root of the sample size.
For modern Excel: STDEV.S calculates the sample standard deviation.
Sample size is the count of numeric values, which COUNT gives you.
Square root is SQRT.
Enter this in any empty cell: =STDEV.S(B2:B13)/SQRT(COUNT(B2:B13))
That’s the one-cell SEM formula you’ll use most of the time.
If you prefer to see the parts, you can calculate them in separate cells:
SD: =STDEV.S(B2:B13)
N: =COUNT(B2:B13)
SEM: =SD_cell/SQRT(N_cell)
Using older workbooks
Older files may use STDEV for the sample standard deviation. It still works: =STDEV(B2:B13)/SQRT(COUNT(B2:B13))
Sample vs population
Use STDEV.S when your data is a sample from a larger population, which is the typical case for SEM.
If you truly have the entire population, you could use STDEV.P:=STDEV.P(B2:B13)/SQRT(COUNT(B2:B13))
In practice, SEM is mainly reported for samples, so STDEV.S is standard.
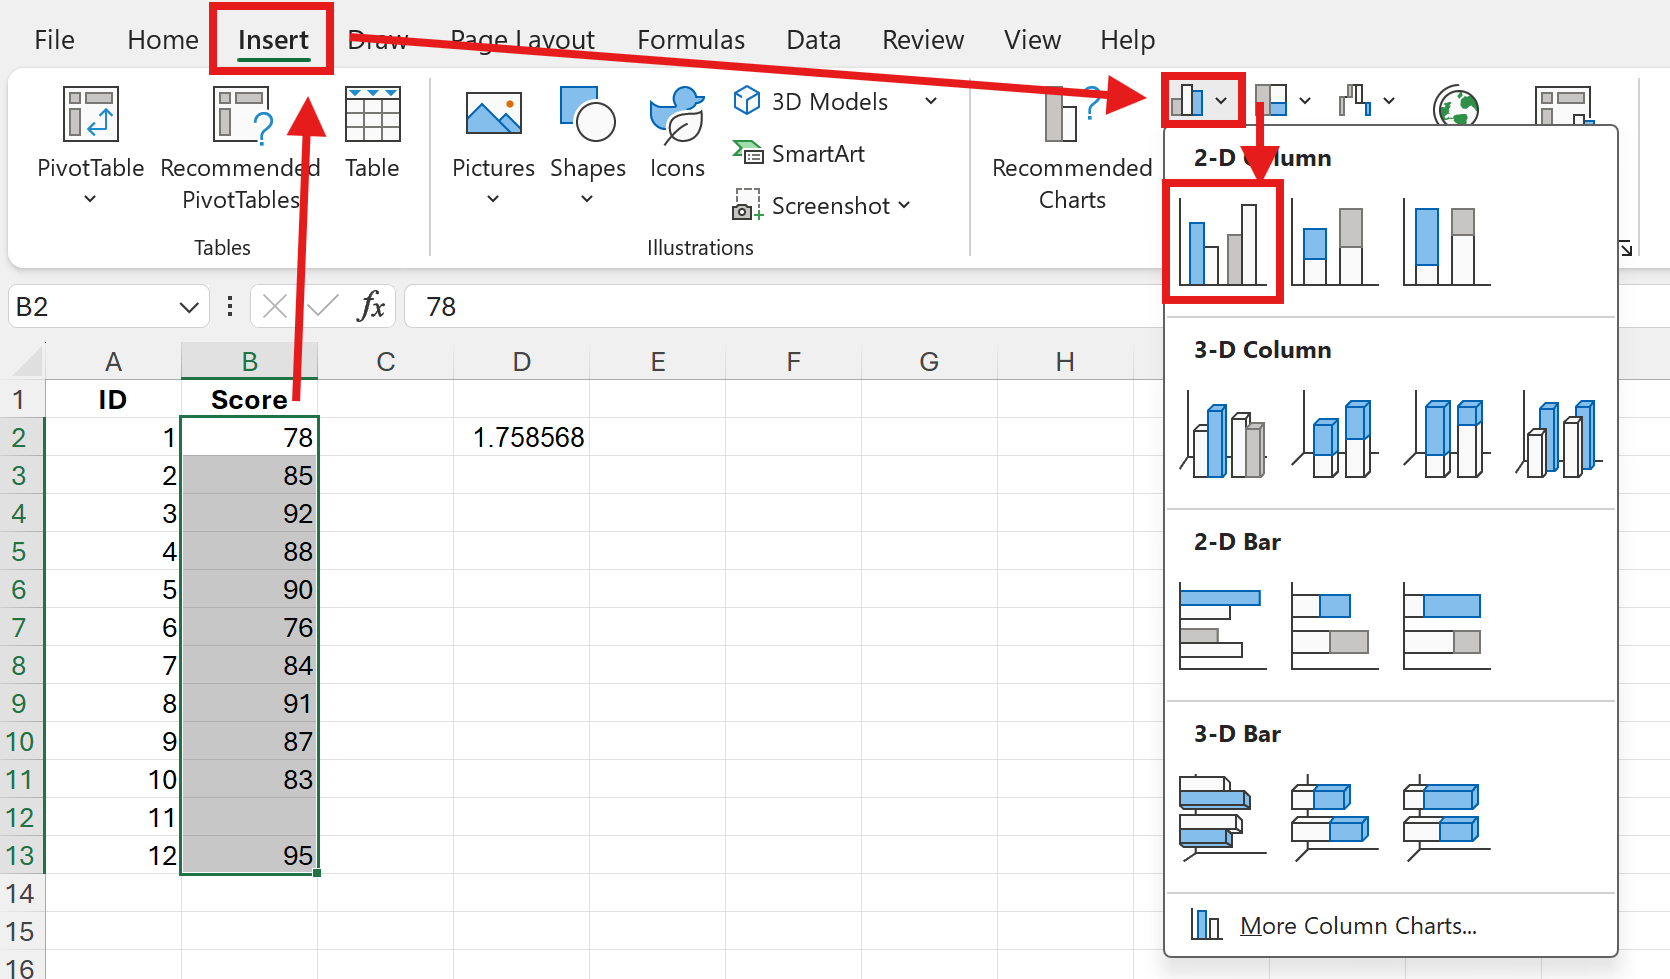
Add standard error bars to a chart
Select your summarized means and insert a chart (for example, a clustered column chart).
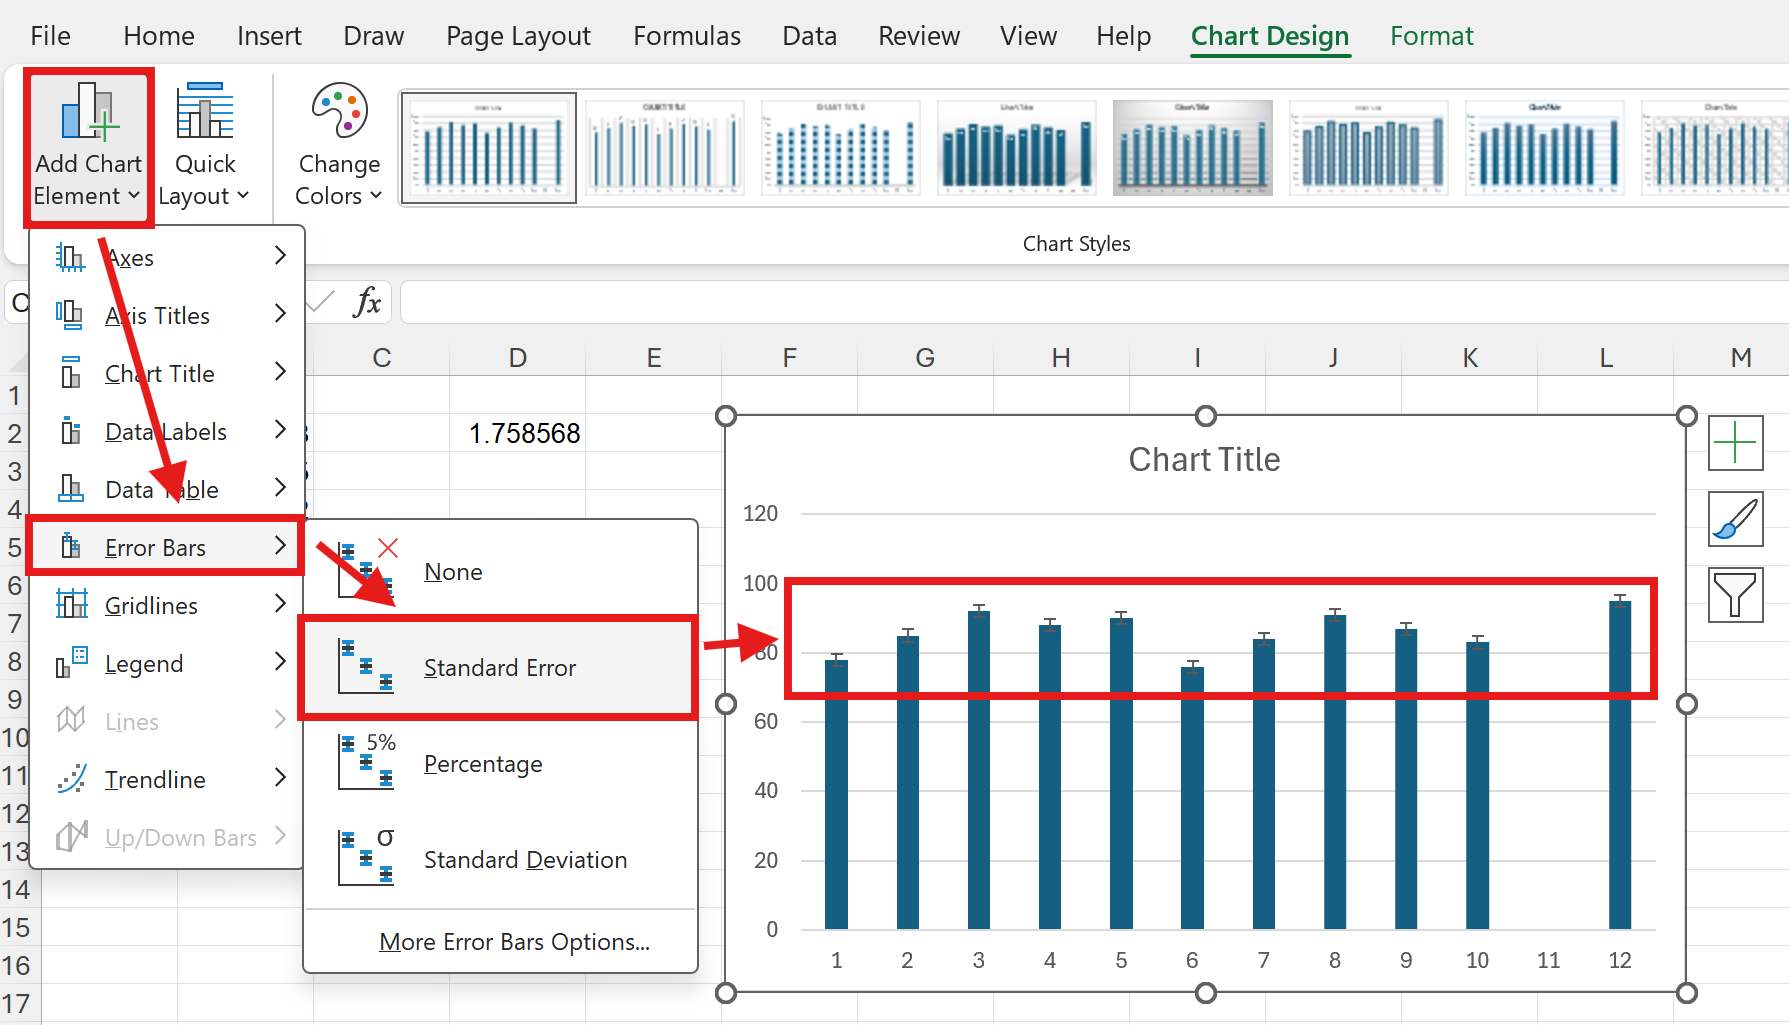
Click the chart, select the Chart Elements button (+), choose Error Bars and select Standard Error.
If you calculated custom SEM values and want to use those:
Choose Error Bars > More Options > Custom
Specify the same SEM range for Positive and Negative error values
Common questions
What’s the difference between SD and SEM?
SD measures spread of individual data points around the mean.
SEM measures precision of the sample mean as an estimate of the population mean and equals SD/√N. SEM shrinks as N grows.
Should I ever report SEM instead of SD?
Report SD when you describe variability among observations. Report SEM when you describe the precision of the mean. Many fields report the mean with either SD or SEM, but they communicate different things, so label clearly.
Why doesn’t Excel have a single SEM function?
Excel provides the building blocks. SEM is straightforward from SD and N, so the combined formula is standard practice.
Go further, faster with AskExcel
For a single column, typing a formula is fine. When you need to:
Compute SEM by group or by date
Clean outliers and recalculate SEM
Build a summary table of Mean, SD, SEM, and 95% CI for multiple segments
Plot charts with correctly matched custom error bars
Document the steps and produce a sharable report
AskExcel makes it effortless. Upload your Excel or CSV, describe what you want in plain language, and get clean results, summaries, and visuals without wrestling with formulas.